Ch09 solution manual intermediate accounting PDF

| Title | Ch09 solution manual intermediate accounting |
|---|---|
| Course | intermediate accounting 1 |
| Institution | The American University in Cairo |
| Pages | 62 |
| File Size | 938.8 KB |
| File Type | |
| Total Downloads | 180 |
| Total Views | 843 |
Summary
CHAPTER 9 Inventories: Additional Valuation Issues ASSIGNMENT CLASSIFICATION TABLE ( TOPIC) Topics Questions Brief Exercises Exercises Problems 1. 1, 2, 3, 4, 5 1, 2, 3 1, 2, 3, 4, 5, 6 1, 2, 3, 10, 11 2. Inventory accounting relative sales value net realizable value. 6, 7, 8 4, 5, 6 7, 8, 9, 10 4 3...
Description
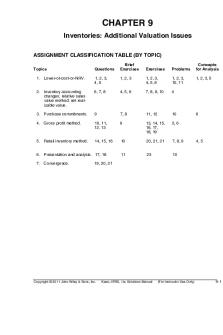
CHAPTER 9 Inventories: Additional Valuation Issues ASSIGNMENT CLASSIFICATION TABLE (BY TOPIC) Topics
Questions
Brief Exercises
Exercises
Problems
1. Lower-of-cost-or-NRV.
1, 2, 3, 4, 5
1, 2, 3
1, 2, 3, 4, 5, 6
1, 2, 3, 10, 11
2. Inventory accounting changes; relative sales value method; net realizable value.
6, 7, 8
4, 5, 6
7, 8, 9, 10
4
3. Purchase commitments.
9
7, 8
11, 12
10
4. Gross profit method.
10, 11, 12, 13
9
13, 14, 15, 16, 17, 18, 19
5, 6
5. Retail inventory method.
14, 15, 16
10
20, 21, 21
7, 8, 9
11
23
10
6. Presentation and analysis. 17, 18 7. Convergence.
Concepts for Analysis 1, 2, 3, 5
6
4, 5
19, 20, 21
Copyright © 2011 John Wiley & Sons, Inc.
Kieso, IFRS, 1/e, Solutions Manual
(For Instructor Use Only)
9-1
ASSIGNMENT CLASSIFICATION TABLE (BY LEARNING OBJECTIVE) Brief Exercises
Learning Objectives
1, 2, 3
Exercises
Problems
1, 2, 3, 4, 5, 6
1, 2, 3, 10, 11 4
1.
Describe and apply the lower-of-cost-or-NRV rule.
2.
Explain when companies value inventories at net realizable value.
4, 5
7, 8
3.
Explain when companies use the relative sales value method to value inventories.
6
9, 10
4.
Discuss accounting issues related to purchase commitments.
7, 8
11, 12
10
5.
Determine ending inventory by applying the gross profit method.
9
13, 14, 15, 16, 17, 18, 19
5, 6
6.
Determine ending inventory by applying the retail inventory method.
10
20, 21, 22
7, 8, 9
7.
Explain how to report and analyze inventory.
9-2
Copyright © 2011 John Wiley & Sons, Inc.
11
23
Kieso, IFRS, 1/e, Solutions Manual
10
(For Instructor Use Only)
ASSIGNMENT CHARACTERISTICS TABLE
Item
Description
Level of Difficulty
E9-1 E9-2 E9-3 E9-4 E9-5 E9-6 E9-7 E9-8 E9-9 E9-10 E9-11 E9-12 E9-13 E9-14 E9-15 E9-16 E9-17 E9-18 E9-19 E9-20 E9-21 E9-22 E9-23
LCNRV. LCNRV. LCNRV. LCNRV—journal entries. LCNRV—valuation account. LCNRV—error effect. Valuation at net realizable value. Valuation at net realizable value. Relative sales value method. Relative sales value method. Purchase commitments. Purchase commitments. Gross profit method. Gross profit method. Gross profit method. Gross profit method. Gross profit method. Gross profit method. Gross profit method. Retail inventory method. Retail inventory method. Retail inventory method. Analysis of inventories.
Simple Simple Simple Simple Moderate Simple Simple Simple Simple Simple Simple Simple Simple Simple Simple Moderate Simple Simple Moderate Moderate Simple Simple Simple
15–20 10–15 15–20 10–15 20–25 10–15 10-15 10-15 15–20 12–17 05–10 15–20 8–13 10–15 15–20 15–20 10–15 15–20 20–25 20–25 12–17 20–25 10–15
P9-1 P9-2 P9-3 P9-4 P9-5 P9-6 P9-7 P9-8
LCNRV. LCNRV. LCNRV—Cost-of-goods-sold and Loss. Valuation at net realizable value. Gross profit method. Gross profit method. Retail inventory method. Retail inventory method.
Simple Moderate Moderate Simple Moderate Complex Moderate Moderate
10–15 25–30 30–35 15-20 20–30 40–45 20–30 20–30
Copyright © 2011 John Wiley & Sons, Inc.
Kieso, IFRS, 1/e, Solutions Manual
(For Instructor Use Only)
Time (minutes)
9-3
ASSIGNMENT CHARACTERISTICS TABLE (Continued) Level of Difficulty
Time (minutes)
Moderate Moderate
20–30 30–40
P9-11
Retail inventory method. Statement and note disclosure, LCNRV, and purchase commitment. LCNRV.
Moderate
30–40
CA9-1 CA9-2 CA9-3 CA9-4 CA9-5 CA9-6
LCNRV. LCNRV. LCNRV. Retail inventory method. Cost determination, LCNRV, retail method. Purchase commitments.
Moderate Moderate Moderate Moderate Moderate Moderate
15–25 20–30 15–20 25–30 15–25 10–15
Item P9-9 P9-10
9-4
Description
Copyright © 2011 John Wiley & Sons, Inc.
Kieso, IFRS, 1/e, Solutions Manual
(For Instructor Use Only)
ANSWERS TO QUESTIONS 1. Where there is evidence that the utility of goods to be disposed of in the ordinary course of business will be less than cost, the difference should be recognized as a loss in the current period, and the inventory should be stated at net realizable value in the financial statements. 2. The usual basis for carrying forward the inventory to the next period is cost. Departure from cost is required; however, when the utility of the goods included in the inventory is less than their cost. This loss in utility should be recognized as a loss of the current period, the period in which it occurred. Furthermore, the subsequent period should be charged for goods at an amount that measures their expected contribution to that period. In other words, the subsequent period should be charged for inventory at prices no higher than those which would have been paid if the inventory had been obtained at the beginning of that period. (Historically, the lower-of-cost-or-net realizable value rule arose from the accounting convention of providing for all losses and anticipating no profits.) In accordance with the foregoing reasoning, the rule of “cost or net realizable value, whichever is lower” may be applied to each item in the inventory, to the total of the components of each major category, or to the total of the inventory, whichever most clearly reflects operations. The rule is usually applied to each item, but if individual inventory items enter into the same category or categories of finished product, alternative procedures are suitable. The arguments against the use of the lower-of-cost-or-net realizable value method of valuing inventories include the following: (a) The method requires the reporting of estimated losses (all or a portion of the excess of actual cost over net realizable value) as definite income charges even though the losses have not been sustained to date and may never be sustained. Under a consistent criterion of realization a drop in net realizable value below original cost is no more a sustained loss than a rise above cost is a realized gain. (b) A price shrinkage is brought into the income statement before the loss has been sustained through sale. Furthermore, if the charge for the inventory write-downs is not made to a special loss account, the cost figure for goods actually sold is inflated by the amount of the estimated shrinkage in price of the unsold goods. The title “Cost of Goods Sold” therefore becomes a misnomer. (c) The method is inconsistent in application in a given year because it recognizes the propriety of implied price reductions but gives no recognition in the accounts or financial statements to the effect of the price increases. (d) The method is also inconsistent in application in one year as opposed to another because the inventory of a company may be valued at cost in one year and at net realizable value in the next year. (e) The lower-of-cost-or-net realizable value method values the inventory in the statement of financial position conservatively. Its effect on the income statement, however, may be the opposite. Although the income statement for the year in which the unsustained loss is taken is stated conservatively, the net income on the income statement of the subsequent period may be distorted if the expected reductions in sales prices do not materialize. 3. The lower-of-cost-or-net realizable value rule may be applied directly to each item or to the total of the inventory (or in some cases, to the total of the components of each major category). The method should be the one that most clearly reflects income. The most common practice is to price the inventory on an item-by-item basis. Companies favor the individual item approach because tax requirements in some countries require that an individual item basis be used unless it involves practical difficulties. In addition, the individual item approach gives the most conservative valuation for balance sheet purposes.
Copyright © 2011 John Wiley & Sons, Inc.
Kieso, IFRS, 1/e, Solutions Manual
(For Instructor Use Only)
9-5
Questions Chapter 9 (Continued) 4. (1) $12.80. (2) $16.10. (3) $13.00. (4) $9.20. (5) $15.90. 5. One approach is to record the inventory at cost and then reduce it to net realizable value, thereby reflecting a loss in the current period (often referred to as the loss method). The loss would then be shown as a separate item in the income statement and the cost of goods sold for the year would not be distorted by its inclusion. An objection to this method of valuation is that an inconsistency is created between the income statement and balance sheet. Companies may record the adjustment either directly to the Inventory account or use the Allowance to Reduce Inventory to Market which is a contra account against inventory on the statement of financial position. Another approach is merely to substitute market for cost when pricing the new inventory (often referred to as the cost of goods sold method). Such a procedure increases cost of goods sold by the amount of the loss and fails to reflect this loss separately. For this reason, many theoretical objections can be raised against this procedure. 6. An exception to the normal recognition rule occurs where the inventory consists of (1) agricultural assets, and (2) commodities held by borker-traders. Some minerals and minerals products may be valued at NRV. 7. (a) Biological assets are measured on initial recognition and at the end of each reporting period at fair value less costs to sell (NRV). Companies record a gain or loss due to changes in the NRV of biological assets in income when it arises. (b) Agricultural produce (which are harvested from biological assets) are measured at fair value less costs to sell (NRV) at the point of harvest. Once harvested, the NRV of the agricultural produce becomes its cost and this asset is accounted for similar to other inventories held for sale in the normal course of business. 8. Relative sales value is an appropriate basis for pricing inventory when a group of varying units is purchased at a single lump-sum price (basket purchase). The purchase price must be allocated in some manner or on some basis among the various units. When the units vary in size, character, and attractiveness, the basis for allocation must reflect both quantitative and qualitative aspects. A suitable basis then is the relative sales value of the units that comprise the inventory. 9. The drop in the market price of the commitment should be charged to operations in the current year if it is material in amount. The following entry would be made [(£6.20 – £5.90) X 150,000] = £45,000: Unrealized Holding Gain or Loss—Income (Purchase Commitments) ............ Purchase Commitment Liability ..................................................................
45,000 45,000
The entry is made because a loss in utility has occurred during the period in which the market decline took place. The account credited in the above entry should be included among the current liabilities on the statement of financial position with an appropriate note indicating the nature and extent of the commitment. This liability indicates the minimum obligation on the commitment contract at the present time—the amount that would have to be forfeited in case of breach of contract. 10. The major uses of the gross profit method are: (1) it provides an approximation of the ending inventory which the auditor might use for testing validity of physical inventory count; (2) it means that a physical count need not be taken every month or quarter; and (3) it helps in determining damages caused by casualty when inventory cannot be counted.
9-6
Copyright © 2011 John Wiley & Sons, Inc.
Kieso, IFRS, 1/e, Solutions Manual
(For Instructor Use Only)
Questions Chapter 9 (Continued) 11. Gross profit as a percentage of sales indicates that the margin is based on selling price rather than cost; for this reason the gross profit as a percentage of selling price will always be lower than if based on cost. Conversions are as follows: 25% on cost = 33 1/3% on cost = 33 1/3% on selling price = 60% on selling price =
20% on selling price 25% on selling price 50% on cost 150% on cost
12. A markup of 25% on cost equals a 20% markup on selling price; therefore, gross profit equals $1,000,000 ($5 million X 20%) and net income equals $250,000 [$1,000,000 – (15% X $5 million)]. The following formula was used to compute the 20% markup on selling price: Gross profit on selling price =
Percentage markup on cost = .25 = 20% 100% + Percentage markup on cost 1 + .25
13. Inventory, January 1, 2011 .................................................................................. Purchases to February 10, 2011 ........................................................................ Freight-in to February 10, 2011 .......................................................................... Merchandise available ................................................................................. Sales to February 10, 2011 ................................................................................. Less gross profit at 40%.............................................................................. Sales at cost .................................................................................................. Inventory (approximately) at February 10, 2011 ...............................
$ 400,000 $1,140,000 60,000
1,200,000 1,600,000
1,950,000 780,000 1,170,000 $ 430,000
14. The validity of the retail inventory method is dependent upon (1) the composition of the inventory remaining approximately the same at the end of the period as it was during the period, and (2) there being approximately the same rate of markup at the end of the year as was used throughout the period. The retail method, though ordinarily applied on a departmental basis, may be appropriate for the business as a unit if the above conditions are met. 15. The conventional retail method is a procedure based on averages whereby inventory figures at retail are reduced to an inventory valuation figure by multiplying the retail figures by a percentage which is the complement of the markup percent. To determine the markup percent, original markups and additional net markups are related to the original cost. The complement of the markup percent is then applied to the inventory at retail after the latter has been reduced by net markdowns, thus in effect achieving a lower-of-cost-or-NRV valuation. An example of reduction to market follows: Assume purchase of 100 items at $1 each, marked to sell at $1.50 each, at which price 80 were sold. The remaining 20 are marked down to $1.15 each.
Copyright © 2011 John Wiley & Sons, Inc.
Kieso, IFRS, 1/e, Solutions Manual
(For Instructor Use Only)
9-7
Questions Chapter 9 (Continued) The inventory at $15.33 is $4.67 below original cost and is valued at an amount which will produce the “normal” 33 1/3% gross profit if sold at the present retail price of $23.00. Computation of Inventory Purchases Sales Markdowns (20 X $.35) Inventory at retail Inventory at lower-of-cost-or-market $23 X 66 2/3% = $15.33 16. (a)
Cost
Retail
$100
$150 (120) (7) $ 23
Ratio 66 2/3%
Ending inventory: Cost Beginning inventory ......................................................................... ¥ 149,000 Purchases .......................................................................................... 1,400,000 Freight-in ............................................................................................ 70,000 Totals......................................................................................... 1,619,000 Add net markups .............................................................................. — ¥1,619,000 Deduct net markdowns.................................................................... Deduct sales ...................................................................................... Ending inventory, at retail ............................................................... Ratio of cost to selling price
¥1,619,000 ¥2,535,500
Retail ¥
283,500 2,160,000 — 2,443,500 92,000 2,535,500 48,000 2,487,500 2,175,000 ¥ 312,500
= 64%.
Ending inventory estimated at cost = 64% X ¥312,500 = ¥200,000. (b)
The retail method, above, showed an ending inventory at retail of ¥312,500; therefore, merchandise not accounted for amounts to ¥17,500 (¥312,500 – ¥295,000) at retail and ¥11,200 (¥17,500 X .64) at cost.
17. The accounting policies adopted in measuring inventories, including the cost formula used (weighted average, FIFO); the total carrying amount of inventories and the carrying amount in classifications (common classifications of inventories are merchandise, production supplies, raw materials, work in progress and finished goods); the carrying amount of inventories carried at fair value less costs to sell; the amount of inventories recognized as an expense during the period; the amount of any write-down of inventories recognized as an expense in the period and the amount of any reversal of any write-down that is recognized as a reduction in the amount of inventories recognized as expense in the period; the circumstances or events that led to the reversal of a write-down of inventories; and the carrying amount of inventories pledged as security for liabilities, if any.
9-8
Copyright © 2011 John Wiley & Sons, Inc.
Kieso, IFRS, 1/e, Solutions Manual
(For Instructor Use Only)
Questions Chapter 9 (Continued) 18. Inventory turnover measures how quickly inventory is sold. Generally, the higher the inventory turnover, the better the enterprise is performing. The more times the inventory turns over, the smaller the net margin can be to earn an appropriate total profit and return on assets. For example, a company can price its goods lower if it has a high inventory turnover. A company with a low profit margin, such as 2%, can earn as much as a company with a high net profit margin, such as 40%, if its inventory turnover is often enough. To illustrate, a grocery store with a 2% profit margin can earn as much as a jewelry store with a 40% profit margin and an inventory turnover of 1 if its turnover is more than 20 times. 19. Key Similarities are (1) the guidelines on who owns the goods—goods in transit, consigned goods, special sales agreements, and the costs to include in inventory are essentially accounted for the same under IFRS and U.S. GAAP; (2) use of specific identification cost flow assumption, where appropriate; (3) unlike property plant and equipment, IFRS does not permit the option of valuing inventories at fair value. As indicated above, IFRS requires inventory to be written down, but inventory cannot ...
Similar Free PDFs

Ch09 - accounting
- 56 Pages

Accounting ch09
- 68 Pages

Solution Ch21 of Intermediate Accounting
- 143 Pages

solution manual management accounting
- 895 Pages

Solution Manual Cost Accounting
- 46 Pages
Popular Institutions
- Tinajero National High School - Annex
- Politeknik Caltex Riau
- Yokohama City University
- SGT University
- University of Al-Qadisiyah
- Divine Word College of Vigan
- Techniek College Rotterdam
- Universidade de Santiago
- Universiti Teknologi MARA Cawangan Johor Kampus Pasir Gudang
- Poltekkes Kemenkes Yogyakarta
- Baguio City National High School
- Colegio san marcos
- preparatoria uno
- Centro de Bachillerato Tecnológico Industrial y de Servicios No. 107
- Dalian Maritime University
- Quang Trung Secondary School
- Colegio Tecnológico en Informática
- Corporación Regional de Educación Superior
- Grupo CEDVA
- Dar Al Uloom University
- Centro de Estudios Preuniversitarios de la Universidad Nacional de Ingeniería
- 上智大学
- Aakash International School, Nuna Majara
- San Felipe Neri Catholic School
- Kang Chiao International School - New Taipei City
- Misamis Occidental National High School
- Institución Educativa Escuela Normal Juan Ladrilleros
- Kolehiyo ng Pantukan
- Batanes State College
- Instituto Continental
- Sekolah Menengah Kejuruan Kesehatan Kaltara (Tarakan)
- Colegio de La Inmaculada Concepcion - Cebu


