Chemical Kinetics - lab report PDF

| Title | Chemical Kinetics - lab report |
|---|---|
| Author | PaKil ThlaCeu |
| Course | Experimental Chemistry II |
| Institution | Indiana University - Purdue University Indianapolis |
| Pages | 4 |
| File Size | 158.4 KB |
| File Type | |
| Total Downloads | 102 |
| Total Views | 368 |
Summary
lab report...
Description
Name: Experiment 4 Chemical Kinetics Instructor: Jessica Harris
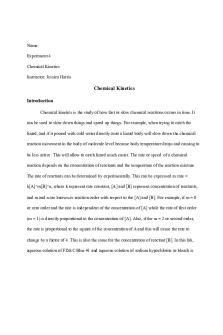
Chemical Kinetics Introduction Chemical kinetics is the study of how fast or slow chemical reactions occurs in time. It can be used to slow down things and speed up things. For example, when trying to catch the lizard, and if it poured with cold water directly onto a lizard body will slow down the chemical reaction movement in the body of molecule level because body temperature drops and causing to be less active. This will allow to catch lizard much easier. The rate or speed of a chemical reaction depends on the concentration of reactants and the temperature of the reaction mixture. The rate of reactants can be determined by experimentally. This can be expressed as rate = k[A]^m[B]^n, where k represent rate constant, [A] and [B] represent concentration of reactants, and m and n are known as reaction order with respect to the [A] and [B]. For example, if m = 0 or zero order and the rate is independent of the concentration of [A] while the rate of first order (m = 1) is directly proportional to the concentration of [A]. Also, if the m = 2 or second order, the rate is proportional to the square of the concentration of A and this will cause the rate to change by a factor of 4. This is also the same for the concentration of reactant [B]. In this lab, aqueous solution of FD&C Blue #1 and aqueous solution of sodium hypochlorite or bleach is
react by using spectroscopy and graphing techniques to determine the rate law and water constant.
Graph Blue and NaOCl Concentration
½ dilute NaOCl Concentration
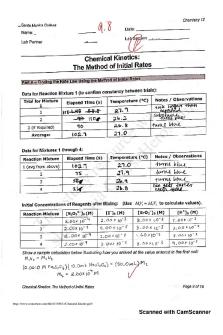
Discussion In this experiment, the rate of reaction between FD&C Blue #1 and sodium hypochlorite is exam at two different experiments. Then, both are used to graph separately in excel to show which is zero order, first order and second order. Also, to show which order have linear relationship. These are graphically plot in Blue versus time, Ln [Blue] versus time, and 1/[Blue] versus time. The first one is a reaction of a mixture of blue solution and NaOCl solution was exam in Spectronic 20 at the transmittance of 630 nm. While running the reaction mixture into the Spectronic, transmittance (%T) is recorded at 1 minute intervals until the transmittance reach approaches 100%. The reason that the concentration solution need to reach about 100% is that the concentration solution need to become colorless completely. This reaction mixture take approximately 21 minutes to reach 99.8 of transmittance. The one that have linear graph for this reaction mixture is first order which is Ln [Blue] versus time. Another reaction mixture is also
done as same procedure for first reaction mixture. The only difference is that the solution is diluted by combining to equal amount of water and NaOCL. This takes 21 minutes to reach 91 of transmittance and first order ( Ln[Blue] vs. time) also have the linear graph.
Solution Chemical kinetics determine the rate of the reaction and the order of each reactant that can be only done by experiment. In this experiment, blue solution and NaOCL solution are used to investigate the rate of reaction or to see how long it takes to reach the 100 percent of transmittance by using Spectronic 20....
Similar Free PDFs

Chemical Kinetics - lab report
- 4 Pages

Lab 11 Chemical Kinetics Report
- 4 Pages

Chemical Kinetics lab
- 9 Pages

Enzyme Kinetics Lab Report
- 14 Pages

Kinetics Lab Report
- 8 Pages

Lab Report - Enzyme Kinetics
- 4 Pages

Topic 15 Chemical Kinetics
- 5 Pages

Enzyme Kinetics 5 - Lab report
- 8 Pages

Chemical Kinetic Lab Report
- 2 Pages

Lab Report Chemical Composition
- 3 Pages

Chapter 14- Chemical Kinetics
- 3 Pages

Chemical Kinetics-DR. ASM
- 44 Pages
Popular Institutions
- Tinajero National High School - Annex
- Politeknik Caltex Riau
- Yokohama City University
- SGT University
- University of Al-Qadisiyah
- Divine Word College of Vigan
- Techniek College Rotterdam
- Universidade de Santiago
- Universiti Teknologi MARA Cawangan Johor Kampus Pasir Gudang
- Poltekkes Kemenkes Yogyakarta
- Baguio City National High School
- Colegio san marcos
- preparatoria uno
- Centro de Bachillerato Tecnológico Industrial y de Servicios No. 107
- Dalian Maritime University
- Quang Trung Secondary School
- Colegio Tecnológico en Informática
- Corporación Regional de Educación Superior
- Grupo CEDVA
- Dar Al Uloom University
- Centro de Estudios Preuniversitarios de la Universidad Nacional de Ingeniería
- 上智大学
- Aakash International School, Nuna Majara
- San Felipe Neri Catholic School
- Kang Chiao International School - New Taipei City
- Misamis Occidental National High School
- Institución Educativa Escuela Normal Juan Ladrilleros
- Kolehiyo ng Pantukan
- Batanes State College
- Instituto Continental
- Sekolah Menengah Kejuruan Kesehatan Kaltara (Tarakan)
- Colegio de La Inmaculada Concepcion - Cebu


