Determinants and Elasticity Notes PDF

| Title | Determinants and Elasticity Notes |
|---|---|
| Author | Faye Henaghan |
| Course | Principles of Microeconomics |
| Institution | University of Liverpool |
| Pages | 4 |
| File Size | 244.1 KB |
| File Type | |
| Total Downloads | 113 |
| Total Views | 149 |
Summary
DETERMINANTS AND ELASTICITY UNI OF LIVERPOOL ECON 123...
Description
Faye Henaghan
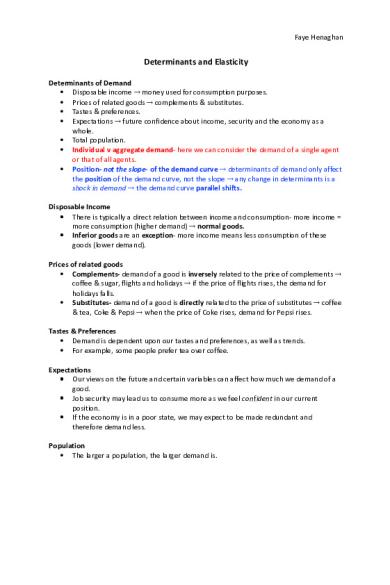
Determinants and Elasticity Determinants of Demand Disposable income money used for consumption purposes. Prices of related goods complements & substitutes. Tastes & preferences. Expectations future confidence about income, security and the economy as a whole. Total population. Individual v aggregate demand- here we can consider the demand of a single agent or that of all agents. Position- not the slope- of the demand curve determinants of demand only affect the position of the demand curve, not the slope any change in determinants is a shock in demand the demand curve parallel shifts. Disposable Income There is typically a direct relation between income and consumption- more income = more consumption (higher demand) normal goods. Inferior goods are an exception- more income means less consumption of these goods (lower demand). Prices of related goods Complements- demand of a good is inversely related to the price of complements coffee & sugar, flights and holidays if the price of flights rises, the demand for holidays falls. Substitutes- demand of a good is directly related to the price of substitutes coffee & tea, Coke & Pepsi when the price of Coke rises, demand for Pepsi rises. Tastes & Preferences Demand is dependent upon our tastes and preferences, as well as trends. For example, some people prefer tea over coffee. Expectations Our views on the future and certain variables can affect how much we demand of a good. Job security may lead us to consume more as we feel confident in our current position. If the economy is in a poor state, we may expect to be made redundant and therefore demand less. Population The larger a population, the larger demand is.
Faye Henaghan
The diagrams show a shock in demand determinants, leading to a parallel shift. Determinants of Supply The technology available to produce the good. The cost of the factors of production (raw materials, etc.) Future expectations- state of the economy, investment prospects, interest rates. The supply side mirrors the demand side in that supply determinants affect the position of the supply curve if they change, the supply curve shifts.
The diagrams show a supply shock, causing a shift in supply.
Equilibrium Equilibrium- where demand meets supply market clears.
Faye Henaghan
This is always the case unless there are inefficiencies/frictions taxes. When there is a shock in either demand or supply, the equilibrium has been perturbed, and thus the economy shifts to a new equilibrium. Adjustment- the speed of adjustment is dependent upon frictions. Where there are no frictions, adjustment is instantaneous.
Price Elasticity of Supply PES- the percentage change in supply due to a 1% increase in the price of a good: Δ QS Q PES= S ΔP P The elasticity of supply tends to be positive- producers make more of a good as the price of the good increases in order to make more profit. PES is between 0 and the higher the PES, the higher the sensitivity of supply with changes in price. Low PES- typically in markets where inputs are scarce and are producing at full capacity short-term production, planning restrictions reduce how many more buildings can be built in response to an increase in property prices. High PES- typically in competitive markets where inputs are available and there is extra production capacity to be ‘tapped into’ there is a steady supply of food, and suppliers can react quickly to changes in prices. In theory, there is a vertical supply curve (where PES=0, i.e. producers cannot react at all to price changes, and the supplied quantity is fixed) and a horizontal supply curve (where PES=, i.e. producers can adjust their supply immediately with no constraints). The vertical supply curve is known as perfectly inelastic supply, the horizontal supply curve is known as perfectly elastic supply.
Government Interventions Minimum and maximum pricing price floors and ceilings.
Faye Henaghan
Tax increases price, causing fall in demand/consumption. Subsidies reduces production costs, reducing overall cost, increasing consumption.
Taxation In an economy without tax, the equilibrium price is PE. When a production tax is introduced, the producers have to pay the government T for each unit of a good they produce. This causes a wedge between the price consumers are paying (P C) and the price produces receive (PP). The tax is the difference between these prices T = PC – PP. When there is no tax PC = PP = T. The tax burden is shared between consumers and producers. Who is worse off? This depends on the PES and PED: o Higher PES- flat supply curve with a steep demand curve leads to consumers being worse off consumer surplus falls. o Lower PES- steeper supply curve with a flatter demand curve leads to producer surplus falling.
The diagrams show the effect of a tax when PES varies. Diagram A shows a low (relatively inelastic) PES, while diagram B shows a high (relatively elastic) PES....
Similar Free PDFs

Elasticity - Lecture notes 5
- 5 Pages

STRESS AND ELASTICITY
- 91 Pages

Elasticity and Demand Exercise
- 3 Pages

Elasticity and Its Application
- 3 Pages

Incentives & Elasticity
- 2 Pages

Chapter 6 Elasticity and Demand
- 17 Pages

Determinants - essay
- 5 Pages

Elasticity worksheet
- 1 Pages

Elasticity(statics)
- 38 Pages

Point Elasticity
- 3 Pages
Popular Institutions
- Tinajero National High School - Annex
- Politeknik Caltex Riau
- Yokohama City University
- SGT University
- University of Al-Qadisiyah
- Divine Word College of Vigan
- Techniek College Rotterdam
- Universidade de Santiago
- Universiti Teknologi MARA Cawangan Johor Kampus Pasir Gudang
- Poltekkes Kemenkes Yogyakarta
- Baguio City National High School
- Colegio san marcos
- preparatoria uno
- Centro de Bachillerato Tecnológico Industrial y de Servicios No. 107
- Dalian Maritime University
- Quang Trung Secondary School
- Colegio Tecnológico en Informática
- Corporación Regional de Educación Superior
- Grupo CEDVA
- Dar Al Uloom University
- Centro de Estudios Preuniversitarios de la Universidad Nacional de Ingeniería
- 上智大学
- Aakash International School, Nuna Majara
- San Felipe Neri Catholic School
- Kang Chiao International School - New Taipei City
- Misamis Occidental National High School
- Institución Educativa Escuela Normal Juan Ladrilleros
- Kolehiyo ng Pantukan
- Batanes State College
- Instituto Continental
- Sekolah Menengah Kejuruan Kesehatan Kaltara (Tarakan)
- Colegio de La Inmaculada Concepcion - Cebu


