EXAM IN ECN280: ENERGY ECONOMICS PDF

| Title | EXAM IN ECN280: ENERGY ECONOMICS |
|---|---|
| Course | Energiøkonomi |
| Institution | Norges miljø- og biovitenskapelige universitet |
| Pages | 3 |
| File Size | 114.5 KB |
| File Type | |
| Total Downloads | 55 |
| Total Views | 147 |
Summary
Home exam ECN280...
Description
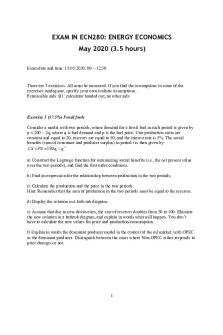
EXAM IN ECN280: ENERGY ECONOMICS May 2020 (3.5 hours) Exam date and time: 18.05.2020, 09 – 12:30
There are 3 exercises. All must be answered. If you find the assumptions in some of the exercises inadequate, specify your own realistic assumptions. Permissible aids: B1: calculator handed out, no other aids
Exercise 1 (37.5%) Fossil fuels Consider a model with two periods, where demand for a fossil fuel in each period is given by p = 200 – 2q, where q is fuel demand and p is the fuel price. Unit production costs are constant and equal to 20, reserves are equal to 50, and the interest rate is 5%. The social benefits (sum of consumer and producer surplus) in period t is then given by: CS + PS = 180qt − qt 2 a) Construct the Lagrange function for maximizing social benefits (i.e., the net present value over the two periods), and find the first order conditions. b) Find an expression for the relationship between production in the two periods. c) Calculate the production and the price in the two periods. Hint: Remember that the sum of production in the two periods must be equal to the reserves. d) Display the solution in a bath tub diagram. e) Assume that due to new discoveries, the size of reserves doubles from 50 to 100. Illustrate the new solution in a bathtub diagram, and explain in words what will happen. You don’t have to calculate the new values for price and production/consumption. f) Explain in words the dominant producer model in the context of the oil market, with OPEC as the dominant producer. Distinguish between the cases where Non-OPEC either responds to price changes or not.
1
Exercise 2 (37.5%) Power market Consider a power market where there is only hydro (reservoir) power production. Total amount of water that can be used during a year corresponds to W = 100 TWh. There are no costs related to producing power, and we disregard discounting. We divide the year into two periods, period 1 (summer) and period 2 (winter). Demand in the two periods are given by: p1( e1 ) = 200 − 4e1 and p2 ( e2 ) = 250 − 3e2 . a) Explain briefly why the social surplus can be expressed as: e1
0
e2
p1 ( z ) dz + p2 ( z) dz 0
b) Express the Lagrange function and solve the problem (i.e., find prices and production in the two periods that maximizes social surplus). You can take it for granted that it is positive production in both periods (e1 > 0 and e2 > 0). c) Illustrate the solution in a bathtub diagram. If you didn’t manage to solve exercise b), you can use the information about W and the demand function given above. d) Give an economic explanation of the solution in b) and c), i.e., why the prices are equal in the two periods. Explain also what is meant by the term water value. e) Assume now instead that the reservoir has a capacity of 40 TWh, and that in the beginning of period 1 it is R0 = 0 in the reservoir. In period 1, there is precipitation/inflow of 80 TWh, while in period 2 there is 20 TWh. Assume also that at the end of period 2, there should be R0 = 0. Find the socially optimal solution. You can still assume positive production in both periods (e1 > 0 and e2 > 0), and also that the reservoir is not emptied in the first period (R1 > 0). f) Give an economic explanation of the solution in e). Explain why the water value is different in the two periods.
2
Exercise 3 (25%) Energy, environment and technology a) Name important factors that should be discussed when considering whether Norway should reduce its oil production due to the climate change problem. b) Explain in words why support to renewable power can lead to higher production of coal power, if an emission trading system for CO2 is already in place. Why would this effect not occur if a CO2 tax was in place instead of an emission trading system for CO2? c) Set up and explain the IPAT identity/equation and each of the components. Give examples of how the three endogenous variables (P, A and T) affect the dependent variable (I). d) Explain (with words and mathematical function) what is meant by a learning curve.
Ås/Oslo, 18/05 2020 Anders Dugstad/Knut Einar Rosendahl (Course responsible / Examiner)
3...
Similar Free PDFs

EXAM IN ECN280: ENERGY ECONOMICS
- 3 Pages

Developments in energy
- 10 Pages

Energy Losses in Bends
- 8 Pages

Energy Crisis in Pakistan
- 11 Pages

Economics Final Exam Review
- 14 Pages

Economics 2 - Exam 1
- 103 Pages

Economics in one lesson
- 2 Pages

Economics Exam Answers 2020
- 5 Pages

Economics Final Exam
- 9 Pages

economics resit Exam 2015
- 2 Pages

Economics in one lesson
- 33 Pages

Band Gap Energy in Silicon
- 6 Pages

Energy Losses IN Bends LAB1
- 13 Pages

Energy
- 5 Pages
Popular Institutions
- Tinajero National High School - Annex
- Politeknik Caltex Riau
- Yokohama City University
- SGT University
- University of Al-Qadisiyah
- Divine Word College of Vigan
- Techniek College Rotterdam
- Universidade de Santiago
- Universiti Teknologi MARA Cawangan Johor Kampus Pasir Gudang
- Poltekkes Kemenkes Yogyakarta
- Baguio City National High School
- Colegio san marcos
- preparatoria uno
- Centro de Bachillerato Tecnológico Industrial y de Servicios No. 107
- Dalian Maritime University
- Quang Trung Secondary School
- Colegio Tecnológico en Informática
- Corporación Regional de Educación Superior
- Grupo CEDVA
- Dar Al Uloom University
- Centro de Estudios Preuniversitarios de la Universidad Nacional de Ingeniería
- 上智大学
- Aakash International School, Nuna Majara
- San Felipe Neri Catholic School
- Kang Chiao International School - New Taipei City
- Misamis Occidental National High School
- Institución Educativa Escuela Normal Juan Ladrilleros
- Kolehiyo ng Pantukan
- Batanes State College
- Instituto Continental
- Sekolah Menengah Kejuruan Kesehatan Kaltara (Tarakan)
- Colegio de La Inmaculada Concepcion - Cebu

