Exam1 review worksheet PDF

| Title | Exam1 review worksheet |
|---|---|
| Course | Introduction To Statistics |
| Institution | University of Nebraska-Lincoln |
| Pages | 4 |
| File Size | 120.7 KB |
| File Type | |
| Total Downloads | 46 |
| Total Views | 147 |
Summary
Exam 1 Review W/S...
Description
Exam 1 review Worksheet STAT218-001 Spring 2018
I.
In a large-scale, cost of living survey undertaken last month in a city, weekly grocery expenses for families with one or two children were found to have a mean of $148. To investigate the current situation, a random sample of 100 families with one or two children were asked their last week’s grocery bills. The sample mean grocery expenses per week was $150 with a standard deviation of $22. Is there any evidence that the weekly grocery expenses for families with one or two children has changed since last month?
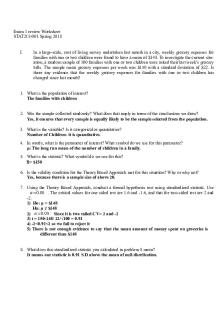
1. What is the population of interest? The families with children 2. Was the sample collected randomly? What does that imply in terms of the conclusions we draw? Yes, it ensures that every sample is equally likely to be the sample selected from the population. 3. What is the variable? Is it categorical or quantitative? Number of Children- it is quantitative. 4. In words, what is the parameter of interest? What symbol do we use for this parameter? μ: The long run mean of the number of children in a family. 5. What is the statistic? What symbol do we use for this? x = $150 6. Is the validity condition for the Theory Based Approach met for this situation? Why or why not? Yes, because there is a sample size of above 20. 7. Using the Theory Based Approach, conduct a formal hypothesis test using standardized statistic. Use α =0.05 . The critical values for one sided test are 1.6 and -1.6, and that for two-sided test are 2 and -2. 1) Ho: μ = $148 Ha: μ ≠ $148 2) α =0.05 Since it is two tailed CV= 2 and -2 3) t = 150-148/ 22/√100 = 0.91 4) -2 .53 2) α =0.01 since it is one sided use 2.3 and -2.3 3) z = .58 - 0.53/ √1-0.53/680 = 2.61 4) 2.61> 2.3 Reject Null Hypothesis
5) We have moderate evidence to say that the probability of customers shopping online will increase from 53%.
1. What type of error could you have made in this scenario? Write the error in context. Type I error 6. In the following situations, indicate whether our strength of evidence will become stronger or weaker. a. It is announced that the researchers were actually only able to get data on 500 customers in 2015. (Assume the value of the observed sample statistics stays the same). i. The strength of evidence would increase. ii. The strength of evidence would decrease. iii. The strength of evidence would stay the same. iv. Not enough information is given. b. We change our research question to “Has there been any evidence to suggest a change in the proportion of online shoppers?” i. The strength of evidence would increase. ii. The strength of evidence would decrease. iii. The strength of evidence would stay the same. iv. Not enough information is given. c. The researchers announced that they made a mistake, and there were actually 410 customers that were shopping online for daily use products. i. The strength of evidence would increase. ii. The strength of evidence would decrease. iii. The strength of evidence would stay the same. iv. Not enough information is given.
III.
For the plot above, choose the correct answer. a. The distribution is (symmetric/skewed). b. The distribution is ……………. (left/right) skewed. c. (Mean/Median) would be good measure to use in this case. Explain briefly why?
you a
Because it is a resistant measure of center and because it is skewed to the left, it will give better measure of center....
Similar Free PDFs

Exam1 review worksheet
- 4 Pages

ECON 1301 Review exam1
- 11 Pages

Exam1 Review - Lecture notes 1-4
- 3 Pages

MKTG Exam1
- 22 Pages

THE2000 exam1
- 6 Pages

Practice Exam1
- 7 Pages

Biochemistry Review Worksheet
- 6 Pages

Biomolecule Review Worksheet
- 4 Pages

Biomolecule Review Worksheet
- 6 Pages

Movie Review Worksheet-F21
- 3 Pages

Test Review Worksheet (Handout)
- 2 Pages

Chapter 5 review worksheet
- 4 Pages
Popular Institutions
- Tinajero National High School - Annex
- Politeknik Caltex Riau
- Yokohama City University
- SGT University
- University of Al-Qadisiyah
- Divine Word College of Vigan
- Techniek College Rotterdam
- Universidade de Santiago
- Universiti Teknologi MARA Cawangan Johor Kampus Pasir Gudang
- Poltekkes Kemenkes Yogyakarta
- Baguio City National High School
- Colegio san marcos
- preparatoria uno
- Centro de Bachillerato Tecnológico Industrial y de Servicios No. 107
- Dalian Maritime University
- Quang Trung Secondary School
- Colegio Tecnológico en Informática
- Corporación Regional de Educación Superior
- Grupo CEDVA
- Dar Al Uloom University
- Centro de Estudios Preuniversitarios de la Universidad Nacional de Ingeniería
- 上智大学
- Aakash International School, Nuna Majara
- San Felipe Neri Catholic School
- Kang Chiao International School - New Taipei City
- Misamis Occidental National High School
- Institución Educativa Escuela Normal Juan Ladrilleros
- Kolehiyo ng Pantukan
- Batanes State College
- Instituto Continental
- Sekolah Menengah Kejuruan Kesehatan Kaltara (Tarakan)
- Colegio de La Inmaculada Concepcion - Cebu


