Final Exam Formula Sheet (Chapter 13, and Chapter 16) PDF

| Title | Final Exam Formula Sheet (Chapter 13, and Chapter 16) |
|---|---|
| Course | Introduction To Statistical Methods |
| Institution | University of Nevada, Las Vegas |
| Pages | 1 |
| File Size | 157 KB |
| File Type | |
| Total Downloads | 65 |
| Total Views | 130 |
Summary
This note covers important contents that will be covered on the final exam ...
Description
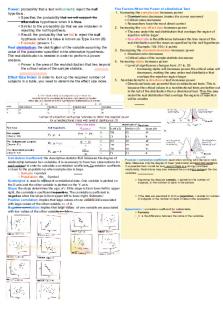
Power: probability that a test will correctly reject the null hypothsis .! ◦ Specifies the probability that we will support the alternative hypothesis when it is true. ! ◦ Similar to the probability (a) that we are mistaken in rejecting the null hypothesis. ! ◦ Recall: the probability that we fail to reject the null hypthesis when it is false is known as Type II error (B) ! ◦ Formula: power= 1 - ! Real distribution: the distribution of the variable assuming the value of the parameter specified in the alternative hypothesis. The real distribution is needed in order to perform a power analysis. ! ◦ Power is the area of the real distribution that lies beyond the critical value of the sample statistic. ! ! Effect Size Index: in order to look up the required number of subjects in a table, you need to determine the effect size index. ! ! !
Five Factors Affect the Power of a Statistical Test: 1. Increasing the sample size increases power! ◦ Standard error decreases (makes the curves narrower) ! ◦ Critical value decreases ! ◦ Researchers have the most direct control! 2. Increasing the raw effect size increases power! ◦ The area under the real distribution that overlaps the region of rejection will be larger! ◦ Raw effect size is the difference betweren the true mean of the real distribution and the mean as specified by the null hypothesis! ‣ Example: 154-150= 4 points! 3. Decreasing the standard deviation increases power ! ◦ Standard error decreases ! ◦ Critical value of the sample statistic decreases ! 4. Increasing alpha increases power ! ◦ Level of significance changes from .01 to .05! ‣ Increasing alpha will increases power, the critical value will decreases, making the area under real distribution that overlaps the rejection region larger! 5. Nondirectional to a directional test increases power ! ◦ Directional tests are powerful than nondirectional tests. This is because the critical values in a nondirectional tests are farther out in the tail of the distribution than a directional test. Thus the area under the real distribution that overlaps the regions of rejection will be smaller.
! !
Correlation Coefficient: the descriptive statistic that measures the degree of relationship between two variables. It is necessary to have two observations for each subject in order to calculate a correlation coefficient. Correlation coeffients r closer to the population p when sample size is large. ! ◦ Sample: r symbol ! ◦ Population: rho Symbol! Scatterplot: is used to represent correlational data. One variable is plotted on the X-axis and the other variable is plotted on the Y- axis. ! Slope: the slope determines the sign of r. If the slope is from lower left to upper right, the correlation coefficient is positive. The correlation coefficient is negative when the slope is from upper left to lower right. Estimate r! Positive correlation: implies that large values of one variable are associated with large values of the other variable, r= +1.0. ! Negative correlation: implies that large values of one variable are associated with low values of the other variable, r=-1.0. ! ! !
Pearson r correlation coefficient: used when working with interval or ratio data. Measures only the degree of linear relationship between two variables. It is possible that r could be zero, even if there is a strong curvilinear relationship. Restrictions may also reduced the correlation between the two variables. ! ! ◦ Assuming the data are sample, n stands for the number of subjects, or the number of pairs in the sample. ! ! ! ! ◦ If the data are assumed to form a population, n stands for number of subjects or the number of pairs of data in the population. ! ! ! Spearman's r : correlation coefficient for ordinal data. ! ◦ Formula: ! ◦ D is the difference between the ranks of the variables. ! ! ! !...
Similar Free PDFs

Final Exam Formula Sheet
- 9 Pages

Final exam formula sheet
- 4 Pages

Final Exam Formula Sheet
- 2 Pages

Eas207-Formula Sheet -final-exam
- 4 Pages

Final formula sheet
- 3 Pages
![Exam Formula Sheet [USED]](https://pdfedu.com/img/crop/172x258/og2vxxd15434.jpg)
Exam Formula Sheet [USED]
- 3 Pages

Formula Sheet for final
- 4 Pages

FE323 Final formula sheet
- 2 Pages

Final Formula Sheet
- 3 Pages

MAST10016 Exam formula sheet
- 2 Pages

Formula sheet final
- 2 Pages
Popular Institutions
- Tinajero National High School - Annex
- Politeknik Caltex Riau
- Yokohama City University
- SGT University
- University of Al-Qadisiyah
- Divine Word College of Vigan
- Techniek College Rotterdam
- Universidade de Santiago
- Universiti Teknologi MARA Cawangan Johor Kampus Pasir Gudang
- Poltekkes Kemenkes Yogyakarta
- Baguio City National High School
- Colegio san marcos
- preparatoria uno
- Centro de Bachillerato Tecnológico Industrial y de Servicios No. 107
- Dalian Maritime University
- Quang Trung Secondary School
- Colegio Tecnológico en Informática
- Corporación Regional de Educación Superior
- Grupo CEDVA
- Dar Al Uloom University
- Centro de Estudios Preuniversitarios de la Universidad Nacional de Ingeniería
- 上智大学
- Aakash International School, Nuna Majara
- San Felipe Neri Catholic School
- Kang Chiao International School - New Taipei City
- Misamis Occidental National High School
- Institución Educativa Escuela Normal Juan Ladrilleros
- Kolehiyo ng Pantukan
- Batanes State College
- Instituto Continental
- Sekolah Menengah Kejuruan Kesehatan Kaltara (Tarakan)
- Colegio de La Inmaculada Concepcion - Cebu


