Lab 4 - the atwood machine PDF

| Title | Lab 4 - the atwood machine |
|---|---|
| Course | General Physics I Laboratory |
| Institution | College of Staten Island CUNY |
| Pages | 9 |
| File Size | 406.8 KB |
| File Type | |
| Total Downloads | 30 |
| Total Views | 157 |
Summary
the atwood machine...
Description
Lab 4: The Atwood Machine
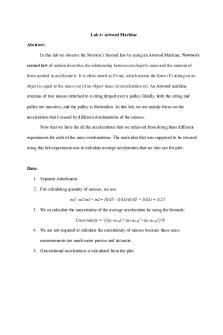
Introduction In this lab we will be testing an Atwood Machine which is simply two masses hung via a string over a frictionless pulley which has a negligible mass. When one heavier mass is released it accelerates down, at the same time the lighter mass accelerates upward with the same acceleration. Using a photo gate to measure this acceleration via the spokes on the Atwood machine. The heavier mass will be released when the lighter mass is touching the ground and data will be collected while the heavier mass descends. By finding this acceleration and plotting it
against
m diff mtotal
the slope of that graph will give us “g” the value of our
experimental acceleration due to gravity. The uncertainty in this acceleration will be the difference between the two measurements we get per trial.
Procedure
To begin this experiment, we must first set the parameters for our logger program that will collect our data with the diameter of the spokes of the Atwood Machine pulley. This will allow the photo gate to read the velocity and acceleration correctly. We then tied a mass to each side of string on the Atwood machine and held the heavier mass up, so that the lighter mass was almost touching the floor. We collected the data for the acceleration of these two masses and then ran it again for a total of two trials. We repeated this 4 more times all with different weight combinations giving us 5 sets of data. Using our data, we calculated an average acceleration for each drop, as well as the uncertainty by using the standard deviation for each of the 5 trials. Afterwards we plotted an average acceleration (
a´ ) vs.
m diff mtotal
graph the slope of which would give us our experimental value
of “g” the acceleration due to gravity. The plotting tool will also calculate the uncertainty in this value using the error values we entered for the acceleration.
Data
Quantity
Mass 1
Mass 2
Unit
Kg
kg
m diff mtotal
a1
a2
a´
m/s^2
m/s^2
m/s^2
σ a´ m/s^2
Mass Combo 1
0.02
0.01
0.33
2.842
2.828
2.835
0.009899494937
Mass Combo 2
0.02
0.05
0.4286
3.855
3.828
3.8415
0.01909188309
Mass Combo 3
0.05
0.1
0.33
3.05
3.042
3.046
0.005656854249
Mass Combo 4
0.05
0.01
0.67
5.942
5.945
5.9435
0.002121320344
Mass Combo 5
a vs
m diff mtotal
Unit Value Uncertainty
0.03
Plot
0.05
0.25
Slope
g
m/s^2
m/s^2
2.193
8.68
8.68
0.0624
0.0624
2.22
2.2065
Data Analysis & Discussion
0.01909188309
The slope of our graph yielded us our experimental value of “g” as 8.68 m/ s 2 with an automatically calculated uncertainty of 0.16 m/ s 2 . 1) What would the acceleration ay of the system be if the masses of the objects 1 and 2 are equal? (m1=m2) What would the tension T of the string be? Explain why these values make sense, based on your expectations. If the two masses on either end of The
Atwood Machine were the same, then the acceleration of the system would be 0. The tension in the string would be equal to the force of gravity (2Fg – 2T=0). These values make sense because there are no unbalanced forces being applied to the system therefore it is in equilibrium. 2) What would the acceleration ay of the system be if the mass of object 2 is much greater than the mass of object 1? (m2≫m1) What would the tension T of the string be? Explain why these values make sense, based on your expectations. The greater the mass of object 2 the closer the acceleration of the system gets to 9.81 m/ s 2 , but
does not reach that value. The tension in the string would be equal to the weight of the mass 2 plus the mass x acceleration (mg + ma). This makes sense because the acceleration of an object in free fall is 9.81 m/ s 2 however while this mass is falling it has the force of tension pulling in the
opposite direction from mass 1, so it will not fall as fast as an object in free fall. 3) Assume that you will do the experiment one more time, but, instead of simply releasing the system, you give a short impulse by pulling the heavier mass downward and then let go of it. In LoggerPro, you analyze the region of the velocity vs. time graph immediately after the impulse duration.
a) For the time interval after the impulse, would you expect the value of acceleration to be different from the value you found in the lab? If yes, how so? If no, why not? Had
we given a short impulse downward to the heavier mass the results of our acceleration would not change since the accelerations due to gravity is constant and, once you let go of the mass the acceleration goes right back to its normal value. b) What happens if you instead give a short impulse in the other direction by pulling the lighter mass downward, and then let go of it? Would the value of acceleration of the system change? If yes, how so? If no, why not? If we had instead given a short
impulse to the lighter mass than the same thing would happen, it would change the initial velocity however the acceleration due to gravity is constant, so the acceleration will remain the same as it did when there was no impulse given. c) Considering these two cases, how does the initial velocity of the system immediately after the impulse change? What about the acceleration of the system? The initial velocity of the system increases in the direction that the impulse was applied, however immediately after the impulse is applied the acceleration will return to its earlier value.
4)
Although our assumptions held decently well during this experiment, we can consider cases with Atwood machines that violate these simplifying conditions. In particular, real mechanical pulley systems may use pulleys that are not perfectly massless and friction-less. How would you expect the acceleration of the system to change, compared to the ideal case, if the pulley were not massless? And, if the pulley were not friction-less? If the pulley were not massless
then the acceleration in either direction would be less because it would require more force to make the masses accelerate, the addition of friction would also cause a decrease in acceleration.
Conclusion Through our experiment, we calculated a value for “g” the acceleration due to gravity as 8.68 m/ s 2 . However, this did not come solely from the acceleration of the heavier mass because, the heavier mass had tension pulling upward on the mass while “g” was accelerating the mass in a downward direction. Our uncertainty for this value was 0.16 m/ s 2 , evidently this value was an underestimate considering the accepted value for “g” is 9.81 m/ s 2 . Our greatest uncertainty I believe arose from the acceleration calculated by the logger pro and issues at the end of each trial when the mass touched the ground. One way I believe the lab could’ve been improved is if the knots were pre-made on the string, and there was some sort of stopped that restricted movement of the wheel after the mass hit the ground. These could help improve the accuracy of readings and save time....
Similar Free PDFs

Lab 4 - the atwood machine
- 9 Pages

Lab( The Atwood Machine )
- 7 Pages

The Atwood Machine - lab report
- 2 Pages

Atwood Machine - Lab report.
- 2 Pages

Atwood LAB
- 5 Pages

atwood lab- lab report
- 4 Pages

Lab Report 2- Atwood Lab
- 6 Pages

Lab 12 - Atwoods Machine
- 6 Pages

LAB Report Lathe Machine
- 13 Pages

Atwood\'s Machine Online Lab
- 4 Pages

Machine Learning LAB Manual
- 66 Pages

Lab Manual Machine Learning
- 27 Pages

The Time Machine
- 8 Pages
Popular Institutions
- Tinajero National High School - Annex
- Politeknik Caltex Riau
- Yokohama City University
- SGT University
- University of Al-Qadisiyah
- Divine Word College of Vigan
- Techniek College Rotterdam
- Universidade de Santiago
- Universiti Teknologi MARA Cawangan Johor Kampus Pasir Gudang
- Poltekkes Kemenkes Yogyakarta
- Baguio City National High School
- Colegio san marcos
- preparatoria uno
- Centro de Bachillerato Tecnológico Industrial y de Servicios No. 107
- Dalian Maritime University
- Quang Trung Secondary School
- Colegio Tecnológico en Informática
- Corporación Regional de Educación Superior
- Grupo CEDVA
- Dar Al Uloom University
- Centro de Estudios Preuniversitarios de la Universidad Nacional de Ingeniería
- 上智大学
- Aakash International School, Nuna Majara
- San Felipe Neri Catholic School
- Kang Chiao International School - New Taipei City
- Misamis Occidental National High School
- Institución Educativa Escuela Normal Juan Ladrilleros
- Kolehiyo ng Pantukan
- Batanes State College
- Instituto Continental
- Sekolah Menengah Kejuruan Kesehatan Kaltara (Tarakan)
- Colegio de La Inmaculada Concepcion - Cebu


