Lab pendulum PDF

| Title | Lab pendulum |
|---|---|
| Author | Sam Park |
| Course | AP Physics 1: Algebra-Based |
| Institution | High School - USA |
| Pages | 3 |
| File Size | 119.2 KB |
| File Type | |
| Total Downloads | 63 |
| Total Views | 161 |
Summary
Roatational Pendulum lab, with data and procedure listed out....
Description
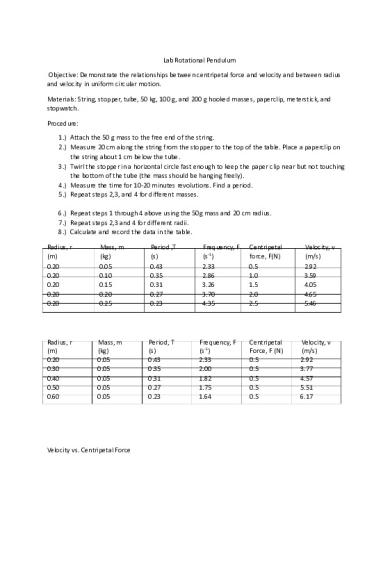
Lab Rotational Pendulum Objective: Demonstrate the relationships between centripetal force and velocity and between radius and velocity in uniform circular motion. Materials: String, stopper, tube, 50 kg, 100 g, and 200 g hooked masses, paperclip, meterstick, and stopwatch. Procedure: 1.) Attach the 50 g mass to the free end of the string. 2.) Measure 20 cm along the string from the stopper to the top of the table. Place a paperclip on the string about 1 cm below the tube. 3.) Twirl the stopper in a horizontal circle fast enough to keep the paper clip near but not touching the bottom of the tube (the mass should be hanging freely). 4.) Measure the time for 10-20 minutes revolutions. Find a period. 5.) Repeat steps 2,3, and 4 for different masses. 6.) Repeat steps 1 through 4 above using the 50g mass and 20 cm radius. 7.) Repeat steps 2,3 and 4 for different radii. 8.) Calculate and record the data in the table. Radius, r (m) 0.20 0.20 0.20 0.20 0.20
Mass, m (kg) 0.05 0.10 0.15 0.20 0.25
Period ,T (s) 0.43 0.35 0.31 0.27 0.23
Radius, r (m) 0.20 0.30 0.40 0.50 0.60
Mass, m (kg) 0.05 0.05 0.05 0.05 0.05
Period, T (s) 0.43 0.35 0.31 0.27 0.23
Velocity vs. Centripetal Force
Frequency, F (s-1) 2.33 2.86 3.26 3.70 4.35
Frequency, F (s-1) 2.33 2.00 1.82 1.75 1.64
Centripetal force, F(N) 0.5 1.0 1.5 2.0 2.5
Centripetal Force, F (N) 0.5 0.5 0.5 0.5 0.5
Velocity, v (m/s) 2.92 3.59 4.05 4.65 5.46
Velocity, v (m/s) 2.92 3.77 4.57 5.51 6.17
Velocity vs Radius
Analysis: 1.) Discuss the shape of the velocity vs. force graph. What does it indicate about the relationship between velocity and centripetal force? The shape of the graph is linear and this indicates that as velocity increases, centripetal force increases as well. They are directly proportional to one another. 2.) Discuss the shape of the velocity vs. radius graph. What does it indicate about the relationship between velocity and radius? The shape again is linear for this graph showing that velocity is directly proportional to the radius. As one increases, so does the other. 3.) Discuss the sources of error. One source of error is that we measured the radius from the end of the weight, while, we should have measured from the center of the weight. Also, our reaction time for stopping the stopwatch after 10 complete revolutions may have affected the period time. Also, we could have been off with counting the revolutions because they were going so fast and this could have affected our times for the period as well. Also, another source of error is the friction we did not account for in our data....
Similar Free PDFs

Lab pendulum
- 3 Pages

Simple Pendulum lab report
- 6 Pages

Lab Report - Simple Pendulum
- 4 Pages

Pendulum Lab Report
- 14 Pages

Ballistic Pendulum Lab
- 6 Pages

Simple Pendulum Lab Report
- 12 Pages

15685729 Simple Pendulum Lab
- 7 Pages

Ballistic Pendulum - Physics Lab
- 5 Pages

Ballistic Pendulum lab report
- 7 Pages

116 simple pendulum - lab report
- 10 Pages

Period of Pendulum Virtual Lab
- 3 Pages

Compound-pendulum
- 7 Pages

Pendulum Experiment
- 5 Pages

Torsional Pendulum
- 23 Pages
Popular Institutions
- Tinajero National High School - Annex
- Politeknik Caltex Riau
- Yokohama City University
- SGT University
- University of Al-Qadisiyah
- Divine Word College of Vigan
- Techniek College Rotterdam
- Universidade de Santiago
- Universiti Teknologi MARA Cawangan Johor Kampus Pasir Gudang
- Poltekkes Kemenkes Yogyakarta
- Baguio City National High School
- Colegio san marcos
- preparatoria uno
- Centro de Bachillerato Tecnológico Industrial y de Servicios No. 107
- Dalian Maritime University
- Quang Trung Secondary School
- Colegio Tecnológico en Informática
- Corporación Regional de Educación Superior
- Grupo CEDVA
- Dar Al Uloom University
- Centro de Estudios Preuniversitarios de la Universidad Nacional de Ingeniería
- 上智大学
- Aakash International School, Nuna Majara
- San Felipe Neri Catholic School
- Kang Chiao International School - New Taipei City
- Misamis Occidental National High School
- Institución Educativa Escuela Normal Juan Ladrilleros
- Kolehiyo ng Pantukan
- Batanes State College
- Instituto Continental
- Sekolah Menengah Kejuruan Kesehatan Kaltara (Tarakan)
- Colegio de La Inmaculada Concepcion - Cebu

