Natural+Selection+M+and+M+Lab PDF

| Title | Natural+Selection+M+and+M+Lab |
|---|---|
| Course | Cell Function And Inheritance |
| Institution | St. Cloud State University |
| Pages | 3 |
| File Size | 212.9 KB |
| File Type | |
| Total Downloads | 33 |
| Total Views | 163 |
Summary
Included in document....
Description
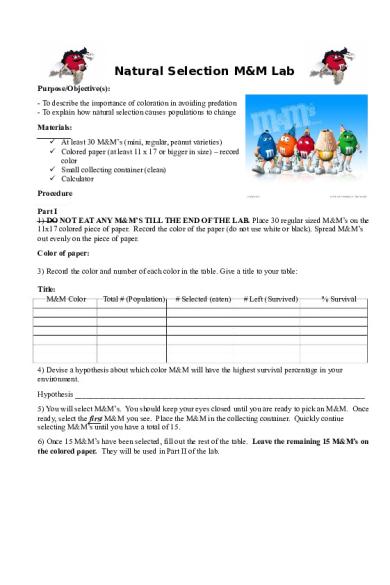
Natural Selection M&M Lab Purpose/Objective(s): - To describe the importance of coloration in avoiding predation - To explain how natural selection causes populations to change Materials: At least 30 M&M’s (mini, regular, peanut varieties) Colored paper (at least 11 x 17 or bigger in size) – record color Small collecting container (clean) Calculator Procedure Part I 1) DO NOT EAT ANY M&M’S TILL THE END OF THE LAB. Place 30 regular sized M&M’s on the 11x17 colored piece of paper. Record the color of the paper (do not use white or black). Spread M&M’s out evenly on the piece of paper. Color of paper: 3) Record the color and number of each color in the table. Give a title to your table: Title: M&M Color
Total # (Population)
# Selected (eaten)
# Left (Survived)
% Survival
4) Devise a hypothesis about which color M&M will have the highest survival percentage in your environment. Hypothesis __________________________________________________________________________ 5) You will select M&M’s. You should keep your eyes closed until you are ready to pick an M&M. Once ready, select the first M&M you see. Place the M&M in the collecting container. Quickly contiue selecting M&M’s until you have a total of 15. 6) Once 15 M&M’s have been selected, fill out the rest of the table. Leave the remaining 15 M&M’s on the colored paper. They will be used in Part II of the lab.
Part II 1) Take the other bag of M&M’s (mini and peanut varieties) and put them on the colored piece of paper along with the M&M’s left from Part I of the lab. Spread them out evenly on the piece of paper. Empty the collecting container (you can eat them if you like). 2) Devise a hypothesis about which color and size M&M will have the highest survival percentage in your environment. Hypothesis __________________________________________________________________________ 3) Using the table below, record the color, size, and number of each color in the table. (mini = small, regular = average, peanut = large). Make sure to title the table. Title: M&M Color
Size
Total # (population)
# Selected (eaten)
# Left (Survived)
% Survival
4) Now it’s time to select M&M’s. Keep your eyes closed until you are ready and then open your eyes and select the first M&M you see. Place the M&M in the collecting container. Continue quickly selecting M&M’s until you have selected 30 M&M’s. 5) Once 30 M&M’s have been selected, fill out the rest of the table.
Data/Results - 2 tables (one from Part I and one from Part II) ***Remember….tables need titles.***
Discussion 1) What was the color of your environment? What is represented by the M&M’s? What do you represent? 2) In Part I of the lab, which two colors had the highest survival percentage? Did this support your hypothesis? Why or why not? 3) In Part I of the lab, which two colors had the lowest survival rates? Why were these colors selected more often than others? 4) Is coloration an important factor in successful predation? Explain why? 5) What is the relationship between the environment and the color of the M&M’s selected? 6) Explain how directional selection might be seen in Part II of the lab. 7) What is the relationship between natural selection and evolution?...
Similar Free PDFs
Popular Institutions
- Tinajero National High School - Annex
- Politeknik Caltex Riau
- Yokohama City University
- SGT University
- University of Al-Qadisiyah
- Divine Word College of Vigan
- Techniek College Rotterdam
- Universidade de Santiago
- Universiti Teknologi MARA Cawangan Johor Kampus Pasir Gudang
- Poltekkes Kemenkes Yogyakarta
- Baguio City National High School
- Colegio san marcos
- preparatoria uno
- Centro de Bachillerato Tecnológico Industrial y de Servicios No. 107
- Dalian Maritime University
- Quang Trung Secondary School
- Colegio Tecnológico en Informática
- Corporación Regional de Educación Superior
- Grupo CEDVA
- Dar Al Uloom University
- Centro de Estudios Preuniversitarios de la Universidad Nacional de Ingeniería
- 上智大学
- Aakash International School, Nuna Majara
- San Felipe Neri Catholic School
- Kang Chiao International School - New Taipei City
- Misamis Occidental National High School
- Institución Educativa Escuela Normal Juan Ladrilleros
- Kolehiyo ng Pantukan
- Batanes State College
- Instituto Continental
- Sekolah Menengah Kejuruan Kesehatan Kaltara (Tarakan)
- Colegio de La Inmaculada Concepcion - Cebu