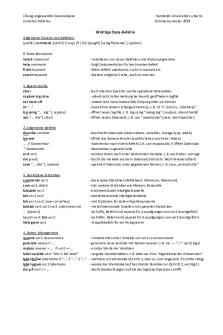
summary of Stata Commands PDF

| Title | summary of Stata Commands |
|---|---|
| Course | Introduction to Psychological Design and Statistics |
| Institution | Macquarie University |
| Pages | 2 |
| File Size | 192.5 KB |
| File Type | |
| Total Downloads | 512 |
| Total Views | 779 |
Summary
Download summary of Stata Commands PDF
Description
STATA COMMANDS Numerical Summaries 1 variable Tabulate variable(s) Tab1 variable(s) Tabulation variable(s) Summarize variable, detail Tabstat variable, statistics (n mean sd median iqr range) Graphical Summaries 1 variable Graph bar (count), over (variable) Graph bar (percent), over (variable) Graph pie, over (variable) Histogram variable Graph hbox variable Numerical Summaries 2 variables Tabulate variable1 variable2 Tabulate variable1 variable, row [gives percentages] Graphical Summaries 2 variables Graph bar (percent), over (variable1) over (variable2) Graph bar (count), over (variable1) over (variable2) Scatter variable1 variable2 Correlate variable1 variable2 Graph box variable1, over (variable2) 1 Categorical 1 Numerical Variable By (cat)variable, sort: summarise (num)variable, detail TEST One-sample Z-test One- sample T-test
CAT/NUM 1 Numerical Known sd 1 Numerical Unknown sd
Chi Squared GOFT Two-sample T-tests
1 Categorical
Paired T-test
RELATED 1 Numerical 1 Categorical
INDEPENDEN T 1 Numerical 1 Categorical
COMMANDS 1. Ztest (num)variable == hypothesised age, sd(sd number) 1. Tabstat variable, stat (n, mean, sd, median, iqr, min, max) 2. Calculate t statistic & df (v = n-1) 3. Ttest variable == hypothesised mean 1. Display chi2tail(df, test-statistic) 2. Csgof variable, expperc(percentage for each category) 1. By (cat)variable, sort: summarize (num)variable 2. Histogram (num)variable, by(cat variable) freq 3. Ttest (num)variable, by (cat variable) Or 1. By (cat)variable, sort: swilk (num)variable 2. Histogram (num) variable, by (cat)variable 3. Robvar (num)variable, by (cat variable) 4. Ttest (num)variable, by (cat variable) 1. Ttest variable1 == variable2
Paired t-tests & one-sample t-tests Chisquared TOI
1. Generate Difference = variable1 – variable2 2. Ttest Difference == 0 2 Categorical
1. Tabulate variable1 variable2, row expected chi2
Shapiro-wilk test for normality Swilk variable Effect Sizes Name Tests Used On Cohen’s D One-sample T-test
Equation D = sample mean – hypothesised mean / sample sd
Cohen’s D
Two-sample T-test
D = mean 1 – mean 2 / pulled sd
Cohen’s D
Paired T-test
D = sample mean difference / sd of difference
Cohen’s W
Chi-squared Tests
W=
x2 chi-squared statistic
Size of Effect...
Similar Free PDFs

summary of Stata Commands
- 2 Pages

Useful Stata Commands
- 48 Pages

Stata commands Study Guide
- 1 Pages

SQL summary of commands
- 3 Pages

List of DOS Commands
- 2 Pages

Chuong-stata
- 80 Pages

Calculator Commands
- 1 Pages

Formal commands
- 4 Pages

Matlab Commands
- 2 Pages

Stata cheatsheets
- 6 Pages

Stata Befehle
- 1 Pages
Popular Institutions
- Tinajero National High School - Annex
- Politeknik Caltex Riau
- Yokohama City University
- SGT University
- University of Al-Qadisiyah
- Divine Word College of Vigan
- Techniek College Rotterdam
- Universidade de Santiago
- Universiti Teknologi MARA Cawangan Johor Kampus Pasir Gudang
- Poltekkes Kemenkes Yogyakarta
- Baguio City National High School
- Colegio san marcos
- preparatoria uno
- Centro de Bachillerato Tecnológico Industrial y de Servicios No. 107
- Dalian Maritime University
- Quang Trung Secondary School
- Colegio Tecnológico en Informática
- Corporación Regional de Educación Superior
- Grupo CEDVA
- Dar Al Uloom University
- Centro de Estudios Preuniversitarios de la Universidad Nacional de Ingeniería
- 上智大学
- Aakash International School, Nuna Majara
- San Felipe Neri Catholic School
- Kang Chiao International School - New Taipei City
- Misamis Occidental National High School
- Institución Educativa Escuela Normal Juan Ladrilleros
- Kolehiyo ng Pantukan
- Batanes State College
- Instituto Continental
- Sekolah Menengah Kejuruan Kesehatan Kaltara (Tarakan)
- Colegio de La Inmaculada Concepcion - Cebu


