C723 - Formula Card PDF

| Title | C723 - Formula Card |
|---|---|
| Course | Quantitative Analysis For Business |
| Institution | Western Governors University |
| Pages | 3 |
| File Size | 149 KB |
| File Type | |
| Total Downloads | 23 |
| Total Views | 164 |
Summary
Formula Card...
Description
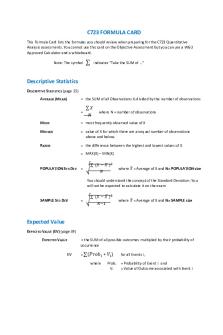
C723 FORMULA CARD This Formula Card lists the formulas you should review when preparing for the C723 Quantitative Analysis assessments. You cannot use this card on the Objective Assessment but you can use a WGU Approved Calculator and a whiteboard. Note: The symbol
∑
indicates “Take the SUM of …”
Descriptive Statistics DESCRIPTIVE STATISTICS (page 25) = the SUM of all Observations Xi divided by the number of observations
AVERAGE (MEAN)
=
∑𝑋 𝑁
where N = number of observations
MODE
= most frequently observed value of X
MEDIAN
= value of X for which there are an equal number of observations above and below.
RANGE
= the difference between the highest and lowest values of X = MAX(X) – MIN(X)
POPULATION STD DEV =
√
∑ (𝑋 − 𝑋 )2 𝑁
= Average of X and N= POPULATION size where 𝑋
You should understand the concept of the Standard Deviation. You will not be expected to calculate it on the exam
SAMPLE STD DEV
=
√
∑ (𝑋 − 𝑋 )2 𝑁−1
where 𝑋 = Average of X and N= SAMPLE size
Expected Value EXPECTED VALUE (EV) (page 39) EXPECTED VALUE
EV
= the SUM of all possible outcomes multiplied by their probability of occurrence = ∑(𝑃𝑟𝑜𝑏𝑖 where
∗ 𝑉𝑖 ) Probi Vi
for all Events i, = Probability of Event i and = Value of Outcome associated with Event i
Network Analysis (Project Management) CALCULATE TIME DURATION ESTIMATES (pages 12 and 49)
𝑇𝑒 =
(𝑂+4𝑀+𝑃 ) 6
where 𝑇𝑒 is the time estimate, 𝑂 is the optimistic time estimate for the task, 𝑀 is the most likely time estimate, and 𝑃 is the pessimistic time estimate. This is in effect a weighted average with M, the most likely time, getting 4 units and the optimistic time (O) and Pessimistic (P) time each getting 1 unit of weight.
Inventory Management ECONOMIC ORDER QUANTITY (EOQ) (page 66)
EOQ
=√
2𝐷𝐶𝑜 ℎ𝑃
=
√
2𝐷𝐶𝑜 𝐻
where 2 is a constant, 𝐷 is the annual demand, 𝐶𝑜 is the cost to place an order, ℎ is the holding cost % per unit per year, P is the purchase price (cost) per unit. NOTE: The Denominator can be expressed as hP or H, depending on the data provided. hP may be replaced by H, where H = Holding Cost in $ per Unit per Year NOTE: It is critical that the Demand (D), Holding Cost % (h) or Holding Cost per Unit (H) are in the same time units, Annual, Monthly or Daily. Be prepared to convert D, h or H into same time units. TOTAL ANNUAL INVENTORY COST (page 66) Total Inventory Cost = Annual Purchases = D*P
+ +
Annual Holding Cost (EOQ/2)*hP
+ Annual Order Cost + (D/EOQ)*Co
ANNUAL HOLDING COST (page 66) Annual Holding Cost = (Average inventory level) * (holding cost per unit per year) = (EOQ/2) *hP ANNUAL ORDERING COST (page 66) Annual Ordering Cost = (Annual Demand) / (Order Quantity) * (Cost per Order) = (D/EOQ)*Co ECONOMIC PRODUCTION QUANTITY (EPQ) (page 66) EPQ = √
2𝐷𝐶𝑜 𝑅
𝐻∗(𝑅−𝐷)
where EPQ is the economic production quantity, 𝐷 is the demand, 𝐶𝑜 is the setup cost, 𝑅 is the rate of production, 𝐻 is the holding cost in $ per unit. Note: Demand, rate of production and holding cost per unit must be in the same units of (e.g., daily or annual).
Linear Programming READING LINEAR PROGRAMMING OUTPUT REPORTS (page 63 using Format found in PA and OA) Consider the following linear programming formulation: MIN 200R + 100N + 50S Subject to 100R + 200N + 300S >= 5000 R...
Similar Free PDFs

C723 - Formula Card
- 3 Pages

Formula
- 36 Pages

Med Card Hydralazine - Med card
- 1 Pages

Med Card Carvedilol - Med card
- 1 Pages

Octreotide med card - med card
- 1 Pages

Credit Card vs Debit Card
- 1 Pages

Hyundai Card
- 4 Pages

GREETING CARD
- 9 Pages

Formula sheet
- 4 Pages

Formula Sheet
- 4 Pages

Formula- Sheet
- 11 Pages

Formula sheet
- 1 Pages

Formula sheet
- 1 Pages
Popular Institutions
- Tinajero National High School - Annex
- Politeknik Caltex Riau
- Yokohama City University
- SGT University
- University of Al-Qadisiyah
- Divine Word College of Vigan
- Techniek College Rotterdam
- Universidade de Santiago
- Universiti Teknologi MARA Cawangan Johor Kampus Pasir Gudang
- Poltekkes Kemenkes Yogyakarta
- Baguio City National High School
- Colegio san marcos
- preparatoria uno
- Centro de Bachillerato Tecnológico Industrial y de Servicios No. 107
- Dalian Maritime University
- Quang Trung Secondary School
- Colegio Tecnológico en Informática
- Corporación Regional de Educación Superior
- Grupo CEDVA
- Dar Al Uloom University
- Centro de Estudios Preuniversitarios de la Universidad Nacional de Ingeniería
- 上智大学
- Aakash International School, Nuna Majara
- San Felipe Neri Catholic School
- Kang Chiao International School - New Taipei City
- Misamis Occidental National High School
- Institución Educativa Escuela Normal Juan Ladrilleros
- Kolehiyo ng Pantukan
- Batanes State College
- Instituto Continental
- Sekolah Menengah Kejuruan Kesehatan Kaltara (Tarakan)
- Colegio de La Inmaculada Concepcion - Cebu


