Chapter 9 Textbook question Solution PDF

| Title | Chapter 9 Textbook question Solution |
|---|---|
| Author | Ali Hussein |
| Course | International business |
| Institution | German Jordanian University |
| Pages | 5 |
| File Size | 219.4 KB |
| File Type | |
| Total Downloads | 19 |
| Total Views | 182 |
Summary
Download Chapter 9 Textbook question Solution PDF
Description
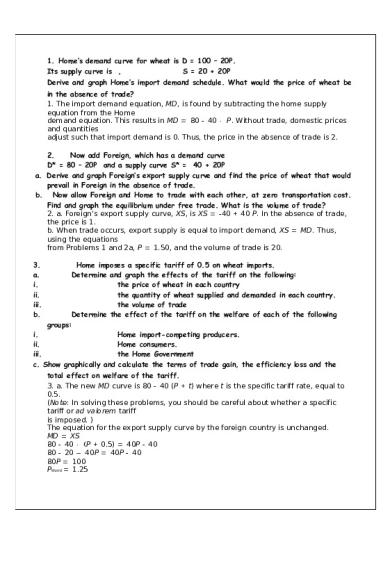
1. Home’s demand curve for wheat is D = 100 – 20P. Its supply curve is , S = 20 + 20P Derive and graph Home’s import demand schedule. What would the price of wheat be in the absence of trade? 1. The import demand equation, MD, is found by subtracting the home supply equation from the Home demand equation. This results in MD 80 40 P. Without trade, domestic prices and quantities adjust such that import demand is 0. Thus, the price in the absence of trade is 2. 2. Now add Foreign, which has a demand curve D* = 80 – 20P and a supply curve S* = 40 + 20P a. Derive and graph Foreign’s export supply curve and find the price of wheat that would prevail in Foreign in the absence of trade. b. Now allow Foreign and Home to trade with each other, at zero transportation cost. Find and graph the equilibrium under free trade. What is the volume of trade? 2. a. Foreign’s export supply curve, XS, is XS 40 40 P. In the absence of trade, the price is 1. b. When trade occurs, export supply is equal to import demand, XS MD. Thus, using the equations from Problems 1 and 2a, P 1.50, and the volume of trade is 20. 3. a. i. ii. iii. b.
Home imposes a specific tariff of 0.5 on wheat imports. Determine and graph the effects of the tariff on the following: the price of wheat in each country the quantity of wheat supplied and demanded in each country. the volume of trade Determine the effect of the tariff on the welfare of each of the following groups: i. Home import-competing producers. ii. Home consumers. iii. the Home Government c. Show graphically and calculate the terms of trade gain, the efficiency loss and the total effect on welfare of the tariff. 3. a. The new MD curve is 80 40 (P t) where t is the specific tariff rate, equal to 0.5. (Note: In solving these problems, you should be careful about whether a specific tariff or ad valorem tariff is imposed. ) The equation for the export supply curve by the foreign country is unchanged. MD XS 80 40 P 0.5) 40P 40 80 20 −40P 40P 40 80P 100 PWorld 1.25
PHome PWorld t 1.25 0.5 1.75 Trade MD XS (40 1.25) 40 10 DHome 100 (20 1.75) 65 SHome 20 (20 1.75) 55 DForeign 80 (20 1.25) 55 SForeign 40 (20 1.25) 65 b. and c. The welfare of the Home country is best studied using the combined numerical and graphical solutions presented below in Figure 9-1. PLEASE NOTE THAT THE QUANTITY DEMANDED AT P= 1.75 SHOULD BE 65 IN THE ABOVE DIAGRAM.
where the areas in the figure are: a. 55(1.75 1.50) −0.5(55 50)(1.75 1.50) 13.125 b. 0.5(55 50)(1.75 1.50) 0.625 c. (65 55)(1.75 1.50) 2.50 d. 0.5(70 -65)(1.75 1.50) 0.625 e. (65 55)(1.50 1.25) 2.50 Consumer surplus change: (a b c d) 16.875. Producer surplus change: a 13.125. Government revenue change: c e 5. Efficiency losses b d are exceeded by terms of trade gain e. (Note: In the calculations for the a, b, and d areas, a figure of 0.5 shows up. This is because we are measuring the area of a triangle, which is one-half of the area of the rectangle defined by the product of the horizontal and vertical sides.) 7. Return to the example of problem 2. Starting from free trade, assume that Foreign offers exporters a subsidy of 0.5 per unit. Calculate the effects on the price in each country and on welfare, both of individual groups and of the economy as a whole, in both countries. 7. We first use Foreign’s export supply and Home’s import demand curves to determine the new world price. The Foreign supply of exports curve, with a Foreign subsidy of 0.5 per unit, becomes XS 40 40(p 0.5).
Th ee q u i l i b r i um wo r l dp r i c ei s1 . 2 5a n dt hei nt e r n a l f o r e i g np r i c ei s1 . 7 5 . Th ev o l u meo ft r a d ei s30 . Th ef or e i g nd e ma n da n ds u pp l yc u r v e sa r eu s e dt od e t e r mi n et hec o s t sa n db e n e fit so ft h e s u b s i d y . Co n s t r u c tadi a g r a ms i mi l a rt ot h a ti nt h el e c t u r en o t e sa n dc a l c u l a t et hea r e ao ft h ev a r i o us p o l y g o n s . Co s to ft h es u b s i d y =( 1 . 7 5 1 . 2 5 )3 0 1 5 . I nc r e a s ei np r o d u c e rs u r p l u s=0 . 2 5x70+0 . 5x0 . 2 5x5=1 7 . 5 De c r e a s ei nc o ns u me rs u r p l u s=0 . 2 5x4 5+0 . 5x0 . 2 5x5=1 1 . 8 7 5 Th u s , t h en e tc h a n g ei nwe l f a r et oFo r e i g nd u et ot h es u b s i d yi s17 . 5-1 1 . 8 7 5-1 5 9. 3 7 5. 5. What would be the effective rate of protection on bicycles in China if China places a 50 percent tariff on bicycles, which have a world price of $200, and no tariff on bike components, which together have a world price of $100? 5. The effective rate of protection ( ERP) is defined as (Vt Vw)/Vw, where Vt is the value added under protection and Vw is the value added under free trade. We define value added as the difference between the price of the final good and the price of components. So, Vw $200 $100 $100. With a 50% tariff on bicycles (and a 0% tariff on components), Vt ($200 1.5) $100 $300 $100 $200. Therefore, the ERP (200 100)/100 100%. 6. The United States simultaneously limits import of ethanol for fuel purposes and provides incentives for the use of ethanol in gasoline, which rise the price of ethanol by about 15 percent relative to what it wold be otherwise. We do, however, have free trade in corn, which is fermented and distilled to make ethanol, and accounts for approximately 55 percent of its cost. What is the effective rate of protection on the process of turning corn into ethanol? 6. The effective rate of protection takes into consideration the costs of imported intermediate goods. Here, 55% of the cost can be imported, suggesting with no distortion, Home value added would be 45%. A 15% increase in the price of ethanol, though, means Home value added could be as high as 60% (45% Home value added under free trade 15% increase in the price of ethanol). Effective rate of protection (Vt Vw)/Vw, where Vt is the value added in the presence of trade policies, and Vw is the value added without trade distortions. In this case, we have (60 45)/45 33% effective rate of protection.
9. The nation of Acirema is “small”, unable to affect world prices. It imports peanuts at the price of $10 per bag. The demand curve is D = 400 – 10P & The supply curve is S = 50 + 5P Determine the free trade equilibrium. Then calculate and graph the following effects of an import quota that limits imports to 50 bags. a. The increase in the domestic price. b. The quota rents. c. The consumption distortion loss. d. The production distortion loss. 9. At a price of $10 per bag of peanuts, Acirema imports 200 bags of peanuts ( MD = 350 – 15P=
300 – 15x10 =200) . A quota limiting the import of peanuts to 50 bags has the following effects: a .Th ep r i c eo fp e a n u t sr i s e st o$ 2 0p e rb a g [ a s5 0=35 01 5Po rP=2 0 ] . b .Th equ o t ar e n t sa r e( $ 2 0 $ 1 0 ) 5 0 $ 5 0 0 . [ ( n e wdo me s t i cp r i c ewi t hq u o t a–f r e e t r a d ewo r l dp r i c e )xq u a n t i t yofi mp o r t c .Th ec o n s u mp t i o ndi s t o r t i o nl o s si s0. 5 1 0 0b a g s $ 10p e rb a g $ 5 0 0 . d .Th epr o d u c t i ond i s t o r t i o nl o s si s0 . 5 5 0b a g s $ 1 0p e rb a g $ 2 5 0 ....
Similar Free PDFs

Chapter 13 - Textbook solution
- 54 Pages

Textbook Chapter 9
- 20 Pages

Chapter 9 Textbook
- 4 Pages

Textbook Notes- chapter 9
- 4 Pages

Chapter 9 textbook
- 7 Pages

Chapter 9 - Question Bank
- 26 Pages

Psyc 107 Textbook Chapter 9
- 5 Pages

Textbook Notes (Chapter 4) 9
- 3 Pages

Textbook SOCI 101 Chapter 9
- 8 Pages

Chapter 9, Solution 1
- 97 Pages

Solution Manual chapter 9
- 174 Pages

Sm08 - textbook question answers
- 27 Pages

Textbook Solution ch3
- 3 Pages
Popular Institutions
- Tinajero National High School - Annex
- Politeknik Caltex Riau
- Yokohama City University
- SGT University
- University of Al-Qadisiyah
- Divine Word College of Vigan
- Techniek College Rotterdam
- Universidade de Santiago
- Universiti Teknologi MARA Cawangan Johor Kampus Pasir Gudang
- Poltekkes Kemenkes Yogyakarta
- Baguio City National High School
- Colegio san marcos
- preparatoria uno
- Centro de Bachillerato Tecnológico Industrial y de Servicios No. 107
- Dalian Maritime University
- Quang Trung Secondary School
- Colegio Tecnológico en Informática
- Corporación Regional de Educación Superior
- Grupo CEDVA
- Dar Al Uloom University
- Centro de Estudios Preuniversitarios de la Universidad Nacional de Ingeniería
- 上智大学
- Aakash International School, Nuna Majara
- San Felipe Neri Catholic School
- Kang Chiao International School - New Taipei City
- Misamis Occidental National High School
- Institución Educativa Escuela Normal Juan Ladrilleros
- Kolehiyo ng Pantukan
- Batanes State College
- Instituto Continental
- Sekolah Menengah Kejuruan Kesehatan Kaltara (Tarakan)
- Colegio de La Inmaculada Concepcion - Cebu


![[Solution] Managerial ACCT Week 9 - Chapter 9](https://pdfedu.com/img/crop/172x258/oz3llmje73w9.jpg)