EOQ Problems - Mandatory PDF

| Title | EOQ Problems - Mandatory |
|---|---|
| Course | Global Market Strategy |
| Institution | Fanshawe College |
| Pages | 7 |
| File Size | 374.4 KB |
| File Type | |
| Total Downloads | 71 |
| Total Views | 136 |
Summary
Mandatory...
Description
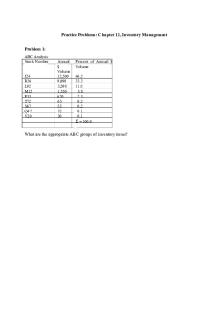
Practice Problems: Chapter 12, Inventory Management Problem 1: ABC Analysis Stock Number
J24 R26 L02 M12 P33 T72 S67 Q47 V20
Annual $ Volume 12,500 9,000 3,200 1,550 620 65 53 32 30
Percent of Annual $ Volume 46.2 33.3 11.8 5.8 2.3 0.2 0.2 0.1 0.1 Σ = 100.0
What are the appropriate ABC groups of inventory items?
Problem 2: A firm has 1,000 “A” items (which it counts every week, i.e., 5 days), 4,000 “B” items (counted every 40 days), and 8,000 “C” items (counted every 100 days). How many items should be counted per day? Problem 3: Assume you have a product with the following parameters:
Holding cost per Order
per unit per order
What is the EOQ? Problem 4: Given the data from Problem 3, and assuming a 300-day work year; how many orders should be processed per year? What is the expected time between orders? Problem 5: What is the total cost for the inventory policy used in Problem 3? Problem 6: Assume that the demand was actually higher than estimated (i.e., 500 units instead of 360 units). What will be the actual annual total cost? Problem 7: If demand for an item is 3 units per day, and delivery lead-time is 15 days, what should we use for a re-order point? Problem 8: Assume that our firm produces type C fire extinguishers. We make 30,000 of these fire extinguishers per year. Each extinguisher requires one handle (assume a 300 day work year for daily usage rate purposes). Assume an annual carrying cost of $1.50 per handle; production setup cost of $150, and a daily production rate of 300. What is the optimal production order quantity?
Problem 9: We need 1,000 electric drills per year. The ordering cost for these is $100 per order and the carrying cost is assumed to be 40% of the per unit cost. In orders of less than 120, drills cost $78; for orders of 120 or more, the cost drops to $50 per unit. Should we take advantage of the quantity discount? Problem 10: Litely Corp sells 1,350 of its special decorator light switches per year, and places orders for 300 of these switches at a time. Assuming no safety stocks, Litely estimates a 50% chance of no shortages in each cycle, and the probability of shortages of 5, 10, and 15 units as 0.2, 0.15, and 0.15 respectively. The carrying cost per unit per year is calculated as $5 and the stockout cost is estimated at $6 ($3 lost profit per switch and another $3 lost in goodwill, or future sales loss). What level of safety stock should Litely use for this product? (Consider safety stock of 0, 5, 10, and 15 units) Problem 11: Presume that Litely carries a modern white kitchen ceiling lamp that is quite popular. The anticipated demand during lead time can be approximated by a normal curve having a mean of 180 units and a standard deviation of 40 units. What safety stock should Litely carry to achieve a 95% service level?
ANSWERS Problem 1: ABC Groups Class Items A B C
J24, R26 L02, M12 P33, T72, S67, Q47, V20
Annual Volume 21,500 4,750 800
Percent of $ Volume 79.5 17.6 2.9 Σ = 100.0
Problem 2: Item Class A B
Quantity
Policy
Number of Items to Count Per Day 1000/5 = 200/day 4000/40=100/day
1,000 4,000
C
8,000
Every 5 days Every 40 days Every 100 8000/100=80/day days Total items to count: 380/day
Problem 3:
Problem 4:
Problem 5:
Problem 6:
Note that while demand was underestimated by nearly 50%, annual cost increases by only 20% an illustration of the degree to which the EOQ model is relatively insensitive to small errors in estimation of demand. Problem 7:
Problem 8:
Problem 9:
Ordering 100 units at $50 per unit is not possible; the discount does not apply until 120 the order equals 120 units. Therefore, we need to compare the total costs for the two alternatives.
Therefore, we should order 120 each time at a unit cost of $50 and a total cost of $52,033. Problem 10:
Carrying cost equals zero.
Stockout cost:
Stockout cost:
(there is no shortage if 15 units are maintained)
Therefore: Minimum cost comes from carrying a 10-unit safety stock. Problem 11: To find the safety stock for a 95% service level it is necessary to calculate the 95th percentile on the normal curve. Using the standard Normal table from the text, we find the Z value for 0.95 is 1.65 standard units. The safety stock is then given by:...
Similar Free PDFs

EOQ Problems - Mandatory
- 7 Pages

EOQ Practice Problems
- 1 Pages

Problems on EOQ with answers
- 5 Pages

Modelo EOQ Básico Inventado
- 1 Pages

Modelo EOQ - wwwwwww
- 17 Pages

Teacher Additional Notes EOQ EBQ
- 6 Pages

Assignment MANDATORY
- 3 Pages

assignment mandatory
- 38 Pages

MCAT Physics - Mandatory Assignment
- 15 Pages

Mandatory Attendance - Navi
- 3 Pages

Essay 2 - Mandatory Assignment
- 5 Pages
Popular Institutions
- Tinajero National High School - Annex
- Politeknik Caltex Riau
- Yokohama City University
- SGT University
- University of Al-Qadisiyah
- Divine Word College of Vigan
- Techniek College Rotterdam
- Universidade de Santiago
- Universiti Teknologi MARA Cawangan Johor Kampus Pasir Gudang
- Poltekkes Kemenkes Yogyakarta
- Baguio City National High School
- Colegio san marcos
- preparatoria uno
- Centro de Bachillerato Tecnológico Industrial y de Servicios No. 107
- Dalian Maritime University
- Quang Trung Secondary School
- Colegio Tecnológico en Informática
- Corporación Regional de Educación Superior
- Grupo CEDVA
- Dar Al Uloom University
- Centro de Estudios Preuniversitarios de la Universidad Nacional de Ingeniería
- 上智大学
- Aakash International School, Nuna Majara
- San Felipe Neri Catholic School
- Kang Chiao International School - New Taipei City
- Misamis Occidental National High School
- Institución Educativa Escuela Normal Juan Ladrilleros
- Kolehiyo ng Pantukan
- Batanes State College
- Instituto Continental
- Sekolah Menengah Kejuruan Kesehatan Kaltara (Tarakan)
- Colegio de La Inmaculada Concepcion - Cebu


