Genetics Penny Genetics PDF

| Title | Genetics Penny Genetics |
|---|---|
| Author | alma hollen |
| Course | Biology II |
| Institution | City Colleges of Chicago |
| Pages | 4 |
| File Size | 237 KB |
| File Type | |
| Total Downloads | 35 |
| Total Views | 149 |
Summary
mouse...
Description
Names_____________________________________________________Due__________________
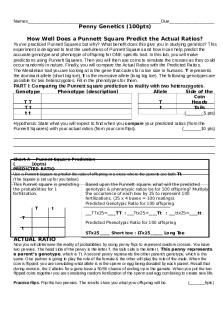
Penny Genetics (100pts) How Well Does a Punnett Square Predict the Actual Ratios? You’ve practiced Punnett Squares but why? What benefit does this give you in studying genetics? This experiment is designed to test the usefulness of Punnett Squares and how it can help predict the accurate genotype and phenotype of offspring for ONE specific trait. In this lab, you will make predictions using Punnett Squares. Then you will then use coins to simulate the crosses as they could occur randomly in nature. Finally, you will compare the Actual Ratios with the Predicted Ratios. The Mendelian trait you are looking at is the gene that codes for a toe size in humans. T represents the dominant allele (short big toe), t is the recessive allele (long big toe). The following genotypes are possible for two heterozygotes. Fill in the phenotypes for them. PART I: Comparing the Punnett square prediction to reality with two heterozygotes. Genotype Phenotype (description) Allele Side of the Coin TT T Heads Tt t Tails tt (_______5 pts) Hypothesis: State what you will expect to find when you compare your predicted ratios (from the Punnett Squares) with your actual ratios (from your coin flips). (_______10 pts)
______________________________________________________ ______________________________________________________ ______________________________________________________ Chart A Punnet Square Prediction (________10pts) PREDICTED RATIO Use a Punnett Square to predict the ratio of offspring in a cross where the parents are both Tt (The Square is set up for you below) This Punnet square is predicting Based upon the Punnett square, what will the predicted the probabilities for 1 genotypic & phenotypic ratios be for 100 offspring? Multiply fertilization. the occurrence of each box by 25 to represent 100 fertilizations. (25 x 4 boxes = 100 matings). Predicted Genotypic Ratio for 100 offspring T t ___TTx25=____TT : ___Ttx25=____Tt : ___ttx25=____tt T Predicted Phenotypic Ratio for 100 offspring t STx25_____ Short toe : LTx25______ Long Toe
ACTUAL RATIO Now you will determine the reality of probabilities by using penny flips to represent random crosses. You have two pennies. The head side of the penny is the letter T, the tails side is the letter t. This penny represents a parent’s genotype, which is Tt. A second penny represents the other parent’s genotype, which is the same. One partner is going to play the role of the female & the other will play the role of the male. When the coin is flipped, you are simulating what allele is in the sperm or egg being donated by each parent. Recall that during meiosis, the 2 alleles for a gene have a 50/50 chance of ending up in the gamete. When you put the two flipped coins together you are simulating random fertilization of the sperm and egg combining to create new life. Practice flips. Flip the two pennies. The results show you what your offspring will be.
(_______5pts)
Did you flip “T-T”, “T-t” or “t-t” __________ What is the Phenotype of this practice flip (long or short)? ________________ Chart B Coin Flip Actual ratios (_______10pts) Actual Ratio: To determine the actual ratio, you will flip your coins 100 times, recording in the table below how often each combination came up. (Use tally marks to record your data then summarize as a number in the total column. Gene Tally marks Total combination TT Tt tt Phenotypes Short Toes (Add TT & Tt) Long Toe (tt)
Total
These two charts show your ACTUAL Ratios
Comparing Actual to Predicted Ratios (________15pts) Predicted Ratios (from Chart A)
Actual Ratios (from Chart B)
TT Tt tt Short Toe Long Toe Would you consider the actual and predicted ratios (circle the best choice)… a. THE SAME?
b. CLOSE TO THE SAME?
c. NOT CLOSE AT ALL?
Part II: What if the Parents are Tt x tt? Using Percentages. (________15pts) 1. First make your predictions by setting up a Punnet square for the parents. (This one is not set up for you) T t x t t What percentage are predicted to be: Short Toe ______ Long Toe ______? 2. Keep one coin on tails and don’t flip (it should always be “t”, right?). Perform 100 flips with the other coin & combine with the “t” penny to simulate your new set of parents. Record your data below.
Tally Tt tt
Total
Based upon your flips, what percentage should have:
Compare the Predicted Percentages of the cross to the Actual Percentages. Predicted (from square)
_____short toes?_____ long toes?
Actual (from flips)
Short toe Long Toe Would you consider the actual and predicted percentages (circle the best choice)… a. THE SAME?
b. CLOSE TO THE SAME?
c. NOT CLOSE AT ALL?
Part III. Analysis Questions (5pts Each) (_______30pts) 1. Use a Punnet Square to predict the phenotypic ratios in this cross: T T x T t Short toe _____ Long toe _____
2. If I told you to flip a coin 4 times, would you expect the coin toss method to give a similar ratio as the Punnett square above? Think about the conclusions drawn from Part I & Part II.
3. What do the pennies or chips represent in the simulation?
4. When you toss a coin to see which side lands up, you are actually simulating what part of the process of sexual reproduction?
5. When you put the two coins that are flipped together, you are simulating what part of the process of sexual reproduction?
6. Overall, do you think Punnet squares are good predictors (models) of the way random allele combinations occur during meiosis & fertilization based upon real-life probabilities over time? What part of this simulation provides evidence for your claim? Explain in great detail in a few sentences.
Part IV. Dyhibrid Crosses What you’ve tested is the validity of monohybrid crosses using Punnet Squares as predictors for the likeliness of an offspring inheriting one trait. The law of independent assortment states that two different genes have no influence on each other in heredity, as long as they are not linked. You will briefly conduct a test on the probability of inheriting any one combination of 2 traits. This is called a DYHIBRID CROSS.
The example to the right is what happens when two separate genes are examined when two flies are crossed. The female fly has a genotype of LlGg and the male has a genotype of LLGg. Notice the egg and sperm show every possible combination for all alleles both parents have. This accounts for the law of independent assortment. To construct the grid, you must know the genotypes of the parents. Then, figure out every possible combination of their alleles. Put mom’s possible allele combinations on top and dad’s possible allele combinations on the side. Distribute the alleles down and across, just like before but, this time, be careful to account for all alleles. When finished, you will have 4 alleles in every box. Then simply count all the like boxes to discover the ratios or percentages. Sample problem. 20 extra credit points. GG = gray hair Gg = gray hair gg = white hair
In rabbits, grey hair is dominant to white hair. Also in rabbits, black eyes are dominant to red eyes.
BB = black eyes Bb = black eyes bb = red eyes
1. What are the phenotypes (trait descriptions) of rabbits that have the following genotypes: Ggbb ______________________ ggbb ______________________
ggBB _________________________ GgBb _________________________
2. A male rabbit with the genotype GGbb is crossed with a female rabbit with the genotype ggBb The square is set up below. Fill it out and determine the phenotypes and proportions in the offspring. How many out of 16 have grey fur and black eyes? ______
How many out of 16 have grey fur and red eyes? ________ How many out of 16 have white fur and black eyes? ______
How many out of 16 have white fur and red eyes? _______
Devise a strategy that could test if this cross matches what coin tosses would produce randomly....
Similar Free PDFs

Genetics Penny Genetics
- 4 Pages

Penny genetics
- 3 Pages

Genetics questionse
- 10 Pages

2.3,5 - Genetics
- 13 Pages

Genetics objectives
- 26 Pages

Mouse Genetics
- 5 Pages

Human Genetics
- 500 Pages

Genetics Tutorial
- 5 Pages

Genetics Notes
- 3 Pages

Genetics -midterm
- 2 Pages

Quiz - Genetics
- 2 Pages

Population Genetics
- 6 Pages

Genetics Vocab
- 5 Pages

Mendalin Genetics - full notes
- 13 Pages

Genetics - Lecture notes 8
- 7 Pages
Popular Institutions
- Tinajero National High School - Annex
- Politeknik Caltex Riau
- Yokohama City University
- SGT University
- University of Al-Qadisiyah
- Divine Word College of Vigan
- Techniek College Rotterdam
- Universidade de Santiago
- Universiti Teknologi MARA Cawangan Johor Kampus Pasir Gudang
- Poltekkes Kemenkes Yogyakarta
- Baguio City National High School
- Colegio san marcos
- preparatoria uno
- Centro de Bachillerato Tecnológico Industrial y de Servicios No. 107
- Dalian Maritime University
- Quang Trung Secondary School
- Colegio Tecnológico en Informática
- Corporación Regional de Educación Superior
- Grupo CEDVA
- Dar Al Uloom University
- Centro de Estudios Preuniversitarios de la Universidad Nacional de Ingeniería
- 上智大学
- Aakash International School, Nuna Majara
- San Felipe Neri Catholic School
- Kang Chiao International School - New Taipei City
- Misamis Occidental National High School
- Institución Educativa Escuela Normal Juan Ladrilleros
- Kolehiyo ng Pantukan
- Batanes State College
- Instituto Continental
- Sekolah Menengah Kejuruan Kesehatan Kaltara (Tarakan)
- Colegio de La Inmaculada Concepcion - Cebu
