Solutions Manual Intermediate Accounting 18e by Stice and Stice Ch23 PDF

| Title | Solutions Manual Intermediate Accounting 18e by Stice and Stice Ch23 |
|---|---|
| Course | Accounting |
| Institution | Đại học Hà Nội |
| Pages | 34 |
| File Size | 477.3 KB |
| File Type | |
| Total Downloads | 27 |
| Total Views | 150 |
Summary
To download more slides, ebook, solutions and test bank, visit CHAPTER 23 QUESTIONS 1. In addition to identifying a weaknesses, financial statement analysis can be used to predict a future profitability and cash flows based on its past performance. profitability, efficiency, and leverage. For each o...
Description
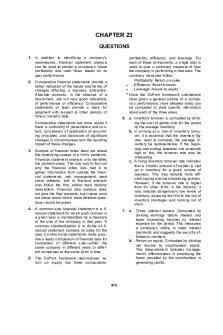
CHAPTER 23 QUESTIONS 1. In addition to identifying a company’s weaknesses, financial statement analysis can be used to predict a company’s future profitability and cash flows based on its past performance.
profitability, efficiency, and leverage. For each of these components, a single ratio is used to give a summary measure of how the company is performing in that area. The summary measures follow: Profitability: Return on sales Efficiency: Asset turnover Leverage: Assets-to-equity Once the DuPont framework calculations have given a general picture of a company’s performance, more detailed ratios can be computed to yield specific information about each of the three areas.
2. Comparative financial statements provide a better indication of the nature and trends of changes affecting a business enterprise. Absolute amounts, in the absence of a benchmark, are not very good indications of performance or efficiency. Comparative statements at least provide a basis for judgment with respect to other periods of time or industry data.
6. a. Inventory turnover is computed by dividing the cost of goods sold for the period by the average inventory. b. In arriving at a rate of inventory turnover, it is essential that the inventory figures used to compute the average inventory be representative. If the beginning and ending balances are unusually high or low, the turnover rate may be misleading. c. A rising inventory turnover rate indicates that a smaller amount of capital is tied up in inventory for a given volume of business. This may indicate more efficient buying and merchandising policies. However, if the turnover rate is higher than for other firms in the industry, it may indicate dangerously low levels of inventory, exposing the firm to the risk of inventory shortages and running out of stock.
Comparative statements are more useful if there is uniformity of presentation and content, consistency of application of accounting principles, and disclosure of significant changes in circumstances and the resulting impact of those changes. 3. Analysis of financial ratios does not reveal the underlying causes of a firm’s problems. Financial statement analysis only identifies the problem areas. The only way to find out why the financial ratios look bad is to gather information from outside the financial statements: ask management, read press releases, talk to financial analysts who follow the firm, and/or read industry newsletters. Financial ratio analysis does not give the final answers, but it does point out areas about which more detailed questions should be asked. 4. A common-size financial statement is a financial statement for which each number in a given year is standardized by a measure of the size of the company in that year. A common standardization is to divide all financial statement numbers by sales for the year. Common-size statements make possible a ready comparison of financial data for companies of different size—either the same company in different years or different companies at the same point in time.
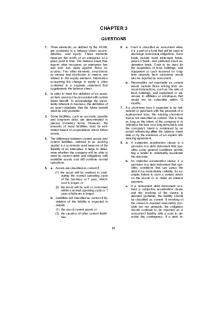
7. a. Times interest earned. Computed by dividing earnings before interest and taxes (operating income) by interest expense for the period. This measures a company’s ability to meet interest payments and suggests the security afforded to creditors. b. Return on equity. Computed by dividing net income by stockholders’ equity. This measurement indicates management’s effectiveness in employing the funds provided by the stockholders in generating profits.
5. The DuPont framework decomposes return on equity into three components:
979
980
Chapter 23
c. Earnings per share. Computed by dividing net income by the weighted average number of common shares outstanding. EPS is a number useful in evaluating the level of cash dividends per share relative to income and in evaluating the market price per share relative to income. d. Price-earnings ratio. Computed by dividing market price per share by earnings per share. The P/E ratio shows how much investors are willing to pay for each dollar of current earnings and is an indication of what investors believe about a company’s future growth prospects. e. Dividend payout ratio. Computed by dividing cash dividends by net income. This ratio reveals what fraction of income a company distributes to shareholders in the form of cash dividends. f. Book-to-market ratio. Computed by dividing total book value of equity by the total market value of shares outstanding. This ratio reveals how the market is currently valuing the net investment in a company relative to the amount of investment originally provided by the stockholders. Book-to-market ratios are usually less than 1.0, indicating that the market value of the firm is greater than the total equity funds provided by the stockholders. 8. One of the factors affecting overall firm performance is the ability to invest in an asset and sell it at a profit. The turnover of the assets affects the return on assets because a profit will be made each time the operating cycle is completed (investment in asset, selling the asset to a customer, collection of cash). If within a given accounting period an organization completes more than one operating cycle, the resulting return on total assets will be a function of the profit percentage on each sale and the number of completed operating cycles. Thus, the return on assets may be increased by either increasing the turnover of assets or by increasing the profit made on each sale. 9. The return on assets equals the ROE when total assets equal total stockhold-
ers’ equity, meaning that there are no liabilities. Overall, the ROE will always exceed the return on assets (unless a company’s liabilities exceed its assets); however, on marginal or new investments, this will be true only if the return on the new assets exceeds the cost of obtaining the additional funds. 10. Ratio comparisons can yield misleading implications if the ratios come from companies with differing accounting practices. Differences in accounting methods can make one company look superior to another even though they are economically identical. For example, if one company uses a 10-year life for depreciating fixed assets and another depreciates similar assets over a 15-year life, the decreased depreciation expense for the second company will make it look more profitable even in the absence of real differences in operating performance. 11. The price equals the amount of dividends divided by the required rate of return on equity capital less the expected dividend growth rate. The equation is as follows: Price =
Forecasted Dividend Next Year r–g
where r is the required rate of return on equity capital and g is the expected future dividend growth rate. 12. Once a business has run out of innovative ideas, growth via new projects will not increase its value to existing shareholders because the discounted present value of new projects is exactly offset by the initial cost of the projects. So, once the ―terminal year‖ is reached when it is expected that the company will have no new aboveaverage ideas, the valuation impact of any additional growth can be ignored. 13. a. Equity valuation is difficult. b. Price/earnings valuation is simple and often relatively accurate, but it begs the question of identifying the underlying determinants of value. c. The most useful part of equity valuation is often what it reveals about what investors must believe about a stock in order to give it its current market price.
Chapter 23
981
PRACTICE EXERCISES PRACTICE 23–1
PREPARING A COMMON-SIZE INCOME STATEMENT
Sales ........................................ Cost of goods sold................. Operating expenses: Marketing expense .......... R&D expense .................... Administrative expense .. Operating income................... Interest expense ..................... Income before income taxes .................................. Income tax expense ............... Net income ..............................
Year 3 $ 350,000 (163,000)
Year 2 100.0% $ 260,000 46.6 (144,000)
Year 1 100.0% $ 300,000 55.4 (156,000)
(21,000) (27,000) (45,000) $ 94,000 (6,000)
6.0 (21,000) 7.7 (6,000) 12.9 (50,000) 26.9% $ 39,000 1.7 (11,000)
8.1 2.3 19.2 15.0% $ 4.2
(22,000) (14,000) (48,000) 60,000 (7,000)
7.3 4.7 16.0 20.0% 2.3
$ 88,000 (25,000) $ 63,000
25.1% $ 28,000 7.1 (8,000) 18.0% $ 20,000
10.8% $ 53,000 3.1 (20,000) 7.7% $ 33,000
17.7% 6.7 11.0%
100.0% 52.0
Note: Minor adjustments to the percentage computations have been made to counteract the cumulative effect of rounding.
PRACTICE 23–2
INTERPRETING A COMMON-SIZE INCOME STATEMENT
In Year 2, overall profitability declined for many reasons. Cost of goods sold, marketing expense, administrative expense, and interest expense all increased as a percentage of sales. A partial explanation for these increases could be that Company A has a large element of fixed costs in its cost structure. Thus, costs don’t decline very much when sales volume declines. The only two expenses to decline as a percentage of sales were R&D and income tax (because of lower income). The decline in R&D expense is symptomatic of a company that is trying to maintain profitability in the short run. Of course, if R&D dries up in the long run, the company will slowly lose its advantage in the market place. Year 3 saw a reversal of all of the bad trends in Year 2. Cost of goods sold, marketing expense, administrative expense, and interest expense all decreased as a percentage of sales. R&D expense increased as a percentage of sales, perhaps to make up for the temporary decline in Year 2. PRACTICE 23–3
PREPARING A COMMON-SIZE BALANCE SHEET
Year 3 Cash......................................... $ 8,000 Accounts receivable .............. 18,000 Inventory ................................. 36,000 Current assets ........................ $ 62,000 Property, plant, and equipment (net) ................ 138,000 Total assets ...................... $ 200,000
*Difference due to rounding
Year 2 2.3% $ 8,000 5.1 37,000 10.3 47,000 17.7% $ 92,000
Year 1 3.1% $ 6,000 14.2 18,000 18.1 36,000 35.4% $ 60,000
2.0% 6.0 12.0 20.0%
39.4 126,000 57.1% $ 218,000
48.5 123,000 83.8%* $ 183,000
41.0 61.0%
982
Chapter 23
PRACTICE 23–4
INTERPRETING A COMMON-SIZE BALANCE SHEET
In Year 2, total assets were 83.8% of sales, compared to just 61.0% of sales in Year 1. This indicates a decrease in efficiency because more assets are needed for each dollar of sales. In Year 2, each asset was used less efficiently than it was in Year 1. Cash, accounts receivable, inventory, and net property, plant, and equipment all increased as a percentage of sales. In Year 3, total assets were 57.1% of sales, compared to 83.8% of sales in Year 2 and 61.0% of sales in Year 1. This indicates a substantial increase in efficiency compared to Year 2 because fewer assets are needed for each dollar of sales. In Year 3, each asset was used more efficiently than it was in Year 2. Cash, accounts receivable, inventory, and net property, plant, and equipment all decreased as a percentage of sales. PRACTICE 23–5 1. 2. 3. 4.
COMPUTING THE DUPONT FRAMEWORK RATIOS
Return on equity Return on sales Asset turnover Assets-to-equity ratio
PRACTICE 23–6
Year 3 60.0% 18.0% 1.75 1.90
Year 2 21.3% 7.7% 1.19 2.32
Year 1 37.1% 11.0% 1.64 2.06
INTERPRETING THE DUPONT FRAMEWORK RATIOS
Return on equity in Year 1 was 37.1%, which is a very good ROE; good companies have ROEs consistently above 15%. The decrease in ROE to 21.3% in Year 2 was the result of a combination of lower profitability (return on sales decreased from 11.0% to 7.7%) and lower efficiency (asset turnover decreased from 1.64 to 1.19). This was partially counterbalanced by an increase in leverage in Year 2; the assets-to-equity ratio increased from 2.06 to 2.32. In Year 3, both profitability and efficiency increased, resulting in a ROE of 60.0% compared to 21.3% in Year 2. The ROE in Year 3 is also significantly higher than in Year 1 (60.0% compared to 37.1%). In Year 3, profitability is higher than in Year 1 (18.0% compared to 11.0%). In addition, efficiency is higher than in Year 1 (asset turnover increased from 1.64 to 1.75). This is partially offset by lower leverage in Year 3 (1.90 assets to equity compared to 2.06 in Year 1). PRACTICE 23–7 1. 2.
ACCOUNTS RECEIVABLE RATIOS
Accounts receivable turnover Average collection period
Year 3 12.7 28.7
Year 2 9.5 38.6
Chapter 23
PRACTICE 23–8 1. 2.
983
INVENTORY RATIOS
Inventory turnover Number of days’ sales in inventory
PRACTICE 23–9
Year 3 3.9 92.9
Year 2 3.5 105.1
FIXED ASSET TURNOVER
Fixed asset turnover
Year 3 2.65
Year 2 2.09
PRACTICE 23–10 MARGIN AND TURNOVER Return on equity = Return on sales
Asset turnover
Assets-to-equity ratio
Company A: 18.0% 1.75 1.90 = 60.0% (rounded) Company B: 7.8% 2.75 1.90 = 40.8% Company C: 24.7% 0.87 1.90 = 40.8% Company A has the highest ROE (60.0%); Companies B and C have the same ROE of 40.8%. In addition, each company is the same on the leverage dimension with an assets-to-equity ratio of 1.90. But each company is very different in terms of its pairing of margin and turnover (return on sales and asset turnover). Company C has very high margins (24.7%) but low turnover (0.87). Company B is at the other extreme with low margins (7.8%) and high turnover (2.75). Company A is in the middle. This exercise illustrates that in the cases of companies B and C, many companies can attain the same overall ROE with vastly different business approaches in terms of margin and turnover. PRACTICE 23–11 DEBT RATIO AND DEBT-TO-EQUITY RATIO 1. 2.
Debt ratio Debt-to-equity ratio
Year 3 47.5% 0.90
Year 2 56.9% 1.32
Year 1 51.4% 1.06
Year 3 15.67
Year 2 3.55
Year 1 8.57
Year 3 1.44
Year 2 1.56
Year 1 1.67
PRACTICE 23–12 TIMES INTEREST EARNED Times interest earned PRACTICE 23–13 CURRENT RATIO Current ratio
984
Chapter 23
PRACTICE 23–14 CASH FLOW ADEQUACY RATIO Operating activities: Net income ............................................................................ Depreciation ......................................................................... Increase in accounts receivable ......................................... Decrease in inventory .......................................................... Increase in accounts payable .............................................. Cash flow from operating activities ............................................
$ 780 300 (150) 75 100 $ 1,105
Investing activities: Cash used to purchase property, plant, and equipment ... Financing activities: Cash from issuance of additional shares of stock ............ Cash used to repay long-term loans ................................... Cash dividends paid ............................................................ Cash flow from financing activities .............................................
$
(400)
$
200
$1,000 (600) (200)
Cash flow from operating activities ............................................ Total primary cash requirements ($400 + $600 + $200) ............. Cash flow adequacy ratio.............................................................
$ 1,105 ÷ $1,200 0.92
PRACTICE 23–15 EARNINGS PER SHARE AND DIVIDEND PAYOUT RATIO 1. Net income ........................................................................ Weighted shares outstanding ......................................... Earnings per share ........................................................... 2.
Company S Company T $ 1,000 $ 15,000 ÷ 200 ÷ 10,000 $ 5.00 $ 1.50
Company S Company T Dividends .......................................................................... $ 50 $ 6,000 Net income ........................................................................ ÷ $1,000 ÷ $15,000 Dividend payout ratio ....................................................... 5.0% 40.0%
Company T is more likely to be an older company in a low-growth industry. Mature companies typically pay a higher proportion of their net income as dividends. The 40% dividend payout ratio for Company T is typical of older, more mature companies in the United States. High-growth companies usually have lower dividend payout ratios, often 0%.
Chapter 23
985
PRACTICE 23–16 PRICE-EARNINGS RATIO AND BOOK-TO-MARKET RATIO 1. Net income ........................................................................ Weighted shares outstanding ......................................... Earnings per share ........................................................... Stock price per share ....................................................... Earnings per share ........................................................... Price-earnings ratio .......................................................... 2. Stock price per share ....................................................... Weighted shares outstanding ......................................... Total market value of equity ............................................ Total stockholders’ equity ............................................... Total market value of equity ............................................ Book-to-market ratio ........................................................
Company M Company N $ 5,000 $ 65,000 ÷ 625 ÷ 125,000 $ 8.00 $ 0.52 $ ÷
64.00 $8.00 8.0
$ ÷
35.00 $0.52 67.3
Company M Company N $ 64.00 $ 35.00 625 125,000 $ 40,000 $ 4,375,000 $ 56,000 ÷ $40,000 1.40
$ 600,000 ÷$4,375,000 0.14
Company N is more likely to be in a high-growth industry. High P/E ratios and low book-to-market ratios are indicative of a company that is expected to grow significantly in the future. PRACTICE 23–17 EQUITY VALUATION USING DIVIDENDS AND P/E RATIO 1.
Dividends/r: $0.65/0.12 = $5.42
2.
Next Year’s Dividends/(r – g): ($0.65 × 1.07)/(0.12 – 0.07) = $13.91
3.
Earnings per share
P/E Ratio: $1.53
18 = $27.54
986
Chapter 23
PRACTICE 23–18 EQUITY VALUATION USING DISCOUNTED FREE CASH FLOW Present Value of Forecasted Free Cash Flow for Burton Dee Free Cash Flow Value for Most Recent Year = $3,500 4 Years of 25% Growth Constant Free Cash Flow Thereafter 12% Required Rate of Return
Free cash flow ............................ Present value as of the end of current year; using 12% rate of return ........ Total present value ....................
Year +1 $ 4,375
Year +2 $5,469
Year +3 $6,836
$ 3,906
$4,360
$4,866
Year +5 Year +4 and After $8,545 $ 8,545 $5,430
$45,254
$63,816
*Value of the perpetuity at the end of Year +4 = $8,545/0.12 = $71,208; PV at end of current year = $45,254 Price = $63,816/3,000 shares = $21.27/share
Chapter 23
987
EXERCISES 23–19. 1.
2013 $ 950,000 595,000 $355,000 115,000 $ 240,000 45,000 $195,000 72,000 $123,000
Sales ......................
Similar Free PDFs

Intermediate accounting 3 by millan
- 16 Pages
Popular Institutions
- Tinajero National High School - Annex
- Politeknik Caltex Riau
- Yokohama City University
- SGT University
- University of Al-Qadisiyah
- Divine Word College of Vigan
- Techniek College Rotterdam
- Universidade de Santiago
- Universiti Teknologi MARA Cawangan Johor Kampus Pasir Gudang
- Poltekkes Kemenkes Yogyakarta
- Baguio City National High School
- Colegio san marcos
- preparatoria uno
- Centro de Bachillerato Tecnológico Industrial y de Servicios No. 107
- Dalian Maritime University
- Quang Trung Secondary School
- Colegio Tecnológico en Informática
- Corporación Regional de Educación Superior
- Grupo CEDVA
- Dar Al Uloom University
- Centro de Estudios Preuniversitarios de la Universidad Nacional de Ingeniería
- 上智大学
- Aakash International School, Nuna Majara
- San Felipe Neri Catholic School
- Kang Chiao International School - New Taipei City
- Misamis Occidental National High School
- Institución Educativa Escuela Normal Juan Ladrilleros
- Kolehiyo ng Pantukan
- Batanes State College
- Instituto Continental
- Sekolah Menengah Kejuruan Kesehatan Kaltara (Tarakan)
- Colegio de La Inmaculada Concepcion - Cebu
