Ternary phase diagrams PDF

| Title | Ternary phase diagrams |
|---|---|
| Course | Freshman Seminar |
| Institution | Northwestern University |
| Pages | 11 |
| File Size | 569.8 KB |
| File Type | |
| Total Downloads | 97 |
| Total Views | 186 |
Summary
Download Ternary phase diagrams PDF
Description
2
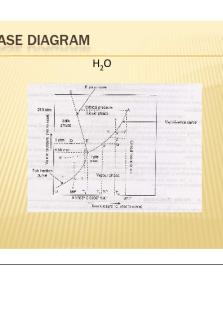
Unary phase diagrams Gibbs’ phase rule: f = c − p + 2 = 1 − p + 2 = 3 − p • Thus, p = 1, 2, 3 • Phase diagram is two-dimensional • Coexistence curves coincide in (a) • Coexistence curves joined by horizontal tie lines in (b): coexistence region
3
• In panel (a), three-phase equilibrium corresponds to a single point • In panel (b), such a point becomes a set of three points on a specific tie line • In panel (c), the tie lines are no longer horizontal; a three-phase equilibrium corresponds to a tie triangle • Note: any number of phases can exist in a unary system, just not simultaneously!
4
Binary phase diagrams • Gibbs’ phase rule: f = c − p + 2 = 2 − p + 2 = 4 − p • Phase diagram is three-dimensional • Simplest structure arises for three thermodynamic potentials • Two-phase coexistence: surfaces • Three-phase coexistence: lines • Four-phase coexistence: points • Quantitative information is obtained from sections, preferably taken at a constant value for a thermodynamic potential
5
6
Isobaric sections have a similar topology as unary phase diagrams (since they have the same number of degrees of freedom):
7
Ternary phase diagrams Here, f = 5 − p, and so two variables must be fixed in order to have a two-dimensional representation. Typically, isothermal isobaric sections are used:
8
Gibbs triangle Representation (c) turns out to be a useful format, but is often shown in a modified (symmetric) form:
9
• Each apex corresponds to a pure system • The sides of the triangle correspond to binary mixtures • A line parallel to a side of the triangle corresponds to a system in which the mole fraction of the component corresponding to the apex facing that side is kept constant
10
Example
Light: three-phase coexistence Dark: two-phase coexistence (metastable region)
14
Lever rule in tie triangles In phase diagrams in which neither of the axes represents are thermodynamic potential, three-phase regions are represented by tie triangles. The lever rule is now immediately generalized, and the mole fractions of the coexisting phases are as follows:
15
fα =
PD AD
PE fβ = BE
PF C fǫ = F...
Similar Free PDFs

Ternary phase diagrams
- 11 Pages

Fe-fe3c phase diagrams
- 4 Pages

Muscle diagrams
- 4 Pages

Phase Rule
- 21 Pages

Phase Diagram
- 4 Pages

Ellingham diagrams
- 4 Pages

Ellingham diagrams
- 4 Pages

F16 Binary to Ternary - Week 3
- 4 Pages

Phase 1 and phase 2 reactions
- 8 Pages

TRAFO 1 PHASE DAN 3 PHASE
- 13 Pages
Popular Institutions
- Tinajero National High School - Annex
- Politeknik Caltex Riau
- Yokohama City University
- SGT University
- University of Al-Qadisiyah
- Divine Word College of Vigan
- Techniek College Rotterdam
- Universidade de Santiago
- Universiti Teknologi MARA Cawangan Johor Kampus Pasir Gudang
- Poltekkes Kemenkes Yogyakarta
- Baguio City National High School
- Colegio san marcos
- preparatoria uno
- Centro de Bachillerato Tecnológico Industrial y de Servicios No. 107
- Dalian Maritime University
- Quang Trung Secondary School
- Colegio Tecnológico en Informática
- Corporación Regional de Educación Superior
- Grupo CEDVA
- Dar Al Uloom University
- Centro de Estudios Preuniversitarios de la Universidad Nacional de Ingeniería
- 上智大学
- Aakash International School, Nuna Majara
- San Felipe Neri Catholic School
- Kang Chiao International School - New Taipei City
- Misamis Occidental National High School
- Institución Educativa Escuela Normal Juan Ladrilleros
- Kolehiyo ng Pantukan
- Batanes State College
- Instituto Continental
- Sekolah Menengah Kejuruan Kesehatan Kaltara (Tarakan)
- Colegio de La Inmaculada Concepcion - Cebu


