5.1. Statistics Handout Key (Skew The Script) PDF

| Title | 5.1. Statistics Handout Key (Skew The Script) |
|---|---|
| Author | Morgan Stone |
| Course | AP Statistics |
| Institution | Skyline High School (California) |
| Pages | 4 |
| File Size | 319 KB |
| File Type | |
| Total Downloads | 10 |
| Total Views | 157 |
Summary
Skew the Script 5.1 handout key. 3 pages of walk through for lesson 5.1 of the ap statistics curriculum....
Description
*All solutions and teacher notes in blue*
AP Statistics Handout Key: Lesson 5.1 Topics: law of large numbers, definition and properties of probability, probability models
Lesson 5.1 Guided Notes Probability and Statistics
estimate
Probabilities
Statistics
generate
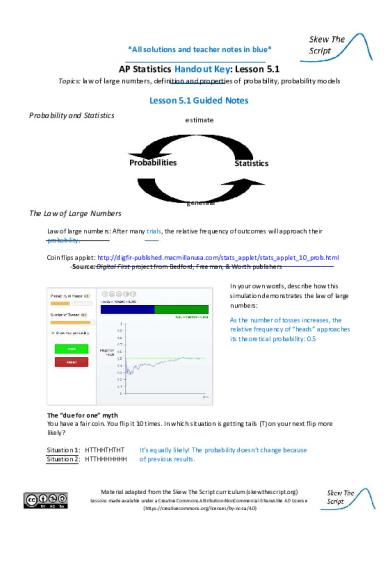
The Law of Large Numbers Law of large numbers: After many trials, the relative frequency of outcomes will approach their probability. Coin flips applet: http://digfir-published.macmillanusa.com/stats_applet/stats_applet_10_prob.html -Source: Digital First project from Bedford, Freeman, & Worth publishers In your own words, describe how this simulation demonstrates the law of large numbers: As the number of tosses increases, the relative frequency of “heads” approaches its theoretical probability: 0.5
The “due for one” myth You have a fair coin. You flip it 10 times. In which situation is getting tails (T) on your next flip more likely? Situation 1: HTTHHTHTHT Situation 2: HTTHHHHHHH
It’s equally likely! The probability doesn’t change because of previous results.
Material adapted from the Skew The Script curriculum (skewthescript.org) Lessons made available under a Creative Commons Attribution-NonCommercial-ShareAlike 4.0 License (https://creativecommons.org/licenses/by-nc-sa/4.0)
2 A tale of two Khris/Chris Davis’s a) How many at-bats did Chris Davis have in a row without recording a hit? 54 straight at-bats without a hit b) What does Chris Davis’s story tell us about the “due for one” myth? Repeated failure doesn’t indicate a higher chance of success on a future attempt. If anything, it may indicate your original estimate of the probability of success was already too high.
Chris Davis
c) Honestly, the Khris Davis batting average streak isn’t really related to the “due for one” myth. However, because Khris Davis’s streak is so incredible and because his name is so similar to the other Davis, I just HAD to include it. So, there’s no question here that requires a response. I hope you enjoyed this part of the lesson!
Khris Davis The Simple Definition of Probability Probability =
𝑁𝑢𝑚𝑏𝑒𝑟 𝑜𝑓 𝑜𝑢𝑡𝑐𝑜𝑚𝑒𝑠 𝑖𝑛 𝑎𝑛 𝑒𝑣𝑒𝑛𝑡 𝑇𝑜𝑡𝑎𝑙 𝑛𝑢𝑚𝑏𝑒𝑟 𝑜𝑓 𝑝𝑜𝑠𝑠𝑖𝑏𝑙𝑒 𝑜𝑢𝑡𝑐𝑜𝑚𝑒𝑠
The above equation is the simple definition of probability • Only used when all outcomes are equally likely Example: There are 8 red marbles and 12 blue marbles in a jar. What is the probability of selecting a red marble from the jar? Let R = the event of selecting a red marble. P(R) = probability of event R occurring. 𝑃(𝑅) =
8 = 0.4 = 40% 20
Properties of Probabilities 1. Probabilities are always between 0 - 1 (0% - 100%). Demonstration: P(R) = 0.4, which is between 0-1 2. The probabilities of all possible events add to 1 (100%). 12 Demonstration: P(R)+P(B) = 1 | P(B) = 20 = .600 | 0.400+ 0.600 = 1 3. Complement rule: the probability of event A not happening, P(AC), is equal to 1 – P(A). Demonstration: P(RC) = 1 – P(R) P(B) = 1 – P(R) P(B) = 1 – 0.400 = 0.600
Material adapted from the Skew The Script curriculum (skewthescript.org) Lessons made available under a Creative Commons Attribution-NonCommercial-ShareAlike 4.0 License (https://creativecommons.org/licenses/by-nc-sa/4.0)
3
Probability Models Probability models: List a set of outcomes and their probabilities. Properties: 1. All probabilities are between 0 – 1. 2. All probabilities add to 1. Example: I have a bag of 20 beads. They are a mix of clear/solid and red/green. There are 6 clear red beads in the bag and 8 red solid beads. There are 2 clear green beads and 4 green solid beads. a) Fill out the probability model
Bead Type
clear red
red solid
clear green
green solid
Probability
6 = 0.30 20
8 = 0.40 20
2 = 0.10 20
4 = 0.20 20
b) Verify that this is a valid probability model (check the probability model properties): All probabilities are between 0 – 1 All probabilities add to 1 → .3+.4+.1+.2 = 1 Let: R = Select a red bead, Q = Select a red solid bead c) Find these probabilities, showing your work: 1. P(Q) = 0.40
2. P(R) = 0.3 + 0.4 = 0.7
3. P(QC ) = .3+.1+.2=.6 or 1 - .4 = .6
4. P(RC ) = 0.1 + 0.2 = 0.3 or 1 – 0.7 = 0.3
Lesson 5.1 Discussion 2011 NYC “Stop and Frisk” police stops:
Race-Ethnicity
Black
Hispanic
White
Proportion of Stops
55.1%
35.2%
9.7%
Proportions calculated just among these three groups (the predominant groups in the dataset) Data source: NYC.GOV, https://www1.nyc.gov/site/nypd/stats/reports-analysis/stopfrisk.page
Population of NYC in 2011:
Race-Ethnicity
Black
Hispanic
White
Population
2,054,101
2,373,304
2,731,173
Data source: 2011 American Community Survey (data.census.gov)
Proportions in NYC Population (among 3 groups): • Black: 2054101/7158578 = 28.7% • Hispanic: 2373304/7158578 = 33.2% • White: 2731173/7158578 = 38.2%
Discussion Question: If stops were done completely at random, which groups would be stopped proportionally more often? Less often? What conclusions can you draw from this? If stops were done at random, the police stop proportions would more closely match the population proportions (see calculations below table). So, black people would be stopped far less frequently, Hispanic people would be stopped slightly less frequently, and white people would be stopped much more frequently. This shows systemic bias in terms of who is stopped. However, the exact cause of the bias cannot be illuminated by this data alone. Two possible causes (among many): racial bias among police officers and/or heavier police presence in areas with more people of color.
Material adapted from the Skew The Script curriculum (skewthescript.org) Lessons made available under a Creative Commons Attribution-NonCommercial-ShareAlike 4.0 License (https://creativecommons.org/licenses/by-nc-sa/4.0)
4
Lesson 5.1 Practice Teachers: provide exercises from your AP Stats textbook (or other resources) about the content covered in this lesson. This lesson matches with the following sections of the most widely-used AP Stats textbooks: • • • •
The Practice of Statistics (AP Edition), 4th-6th editions: sections 5.1 & 5.2 Stats: Modeling the World (AP Edition), 4th/5th editions: ch 13, 3rd edition: ch 14 Statistics: Learning from Data (AP Edition), 2nd edition: sections 5.1 & 5.2 Advanced High School Statistics, section 3.1
Handout Key by statistics student Greyson Zuniga
Material adapted from the Skew The Script curriculum (skewthescript.org) Lessons made available under a Creative Commons Attribution-NonCommercial-ShareAlike 4.0 License (https://creativecommons.org/licenses/by-nc-sa/4.0)...
Similar Free PDFs

The-Legend-Script - script
- 5 Pages

Lewis Structure Handout-KEY
- 2 Pages

Chapter 9 handout-key
- 4 Pages

Seminar assignments - Skew test
- 3 Pages

The purge - script coverage
- 3 Pages

THE Lighthouse script
- 100 Pages

Statistics by the Calculator
- 24 Pages

The Byblos Script
- 32 Pages

The Bee Movie Script
- 11 Pages

The Gorilla King handout
- 12 Pages

Handout-The American Dream
- 5 Pages
Popular Institutions
- Tinajero National High School - Annex
- Politeknik Caltex Riau
- Yokohama City University
- SGT University
- University of Al-Qadisiyah
- Divine Word College of Vigan
- Techniek College Rotterdam
- Universidade de Santiago
- Universiti Teknologi MARA Cawangan Johor Kampus Pasir Gudang
- Poltekkes Kemenkes Yogyakarta
- Baguio City National High School
- Colegio san marcos
- preparatoria uno
- Centro de Bachillerato Tecnológico Industrial y de Servicios No. 107
- Dalian Maritime University
- Quang Trung Secondary School
- Colegio Tecnológico en Informática
- Corporación Regional de Educación Superior
- Grupo CEDVA
- Dar Al Uloom University
- Centro de Estudios Preuniversitarios de la Universidad Nacional de Ingeniería
- 上智大学
- Aakash International School, Nuna Majara
- San Felipe Neri Catholic School
- Kang Chiao International School - New Taipei City
- Misamis Occidental National High School
- Institución Educativa Escuela Normal Juan Ladrilleros
- Kolehiyo ng Pantukan
- Batanes State College
- Instituto Continental
- Sekolah Menengah Kejuruan Kesehatan Kaltara (Tarakan)
- Colegio de La Inmaculada Concepcion - Cebu


