7-1 Project Two Analyzing Databases PDF

| Title | 7-1 Project Two Analyzing Databases |
|---|---|
| Author | John Doe |
| Course | Cyber Defense |
| Institution | Southern New Hampshire University |
| Pages | 4 |
| File Size | 291.5 KB |
| File Type | |
| Total Downloads | 51 |
| Total Views | 148 |
Summary
Some help to get 7-1 project two analyzing databases...
Description
7-1 Project Two: Analyzing Databases 1. Begin by writing SQL commands to capture usable data (which you have preloaded into Codio) for your analysis. Specifically, the product manager wants you to investigate and analyze the following: Analyze the frequency of returns by state, and describe your findings in your report. Analyze the percentage of returns by product type and describe your findings in your report. SQL Commands: SELECT COUNT(*) AS TOTAL_RETURNED, Orders.SKU AS PRODUCT_SKU, Customers.State, RMA.Reason FROM RMA INNER JOIN Orders ON Orders.OrderID = RMA.OrderID JOIN Customers ON Customers.CustomerID = Orders.CustomerID GROUP BY Customers.State -> ORDER BY TOTAL_RETURNED DESC LIMIT 10; After reviewing the data, Massachusetts has 988 returns of BAS-88-1 C. Second is Arkansas with 858 returns of ENT-48-48F, and third is West Virgina with 851 returns of ENT-48-48F. The screenshot below shows the states with the highest returns and reasoning for the returns.
SQL Commands: SELECT Customers.State AS STATE,
(COUNT(*) * 100 / (SELECT COUNT(*) FROM Orders INNER JOIN RMA ON Orders.OrderID = RMA.OrderID)) AS RETURN_PERCENTAGE FROM Orders INNER JOIN RMA ON Orders.OrderID = RMA.OrderID INNER JOIN Customers ON Customers.CustomerID = Orders.CustomerID GROUP BY STATE ORDER BY RETURN_PERCENTAGE DESC LIMIT 10; Here are the percentage numbers for these 10 states
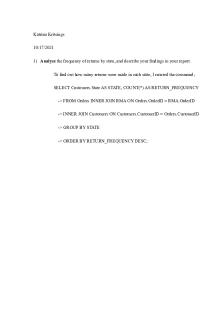
SQL Commands: SELECT sku AS PRODUCT_SKU, description AS PRODUCT_DESCRIPTION, COUNT(*) AS RETURN_FREQUENCY FROM Orders INNER JOIN RMA ON Orders.OrderID = RMA.OrderID GROUP BY PRODUCT_SKU ORDER BY RETURN_FREQUENCY DESC\G The most returned product is the Basic Switch 10/100/1000 BaseT 48 port with 8422 times showing this product needs to be looked at for its defect. Second is Enterprise Switch 48GigE SFP+ 48 Port with 6213 and third Enterprise Switch 10GigE SFP+ 48 port with 4345 showing they also need to be looked at.
SQL Commands: SELECT Orders.SKU AS SKU, COUNT(*) * 100.0 / (SELECT COUNT(*) FROM RMA) AS Percentage FROM RMA INNER JOIN Orders ON Orders.OrderID = RMA.OrderID GROUP BY SKU ORDER BY Percentage DESC;
Below is the percentage of returns of the products BAS-48-1 C is at 22% its 6% more than the second product and a whole 11% above the third product.
How does the data provide the product manager with usable information? All the info produced in the captured usable data can be valuable information for the product manager to know how the products being sold are doing and what is being returned; based on the returns it shows it can determine why they are returns. The product may be defective or subpar and this will help the company adjust to make improvements to these products. What are the potential flaws in the data that has been presented? This information does not really narrow down the exact reasons as to why they were returned and if the products could have come from the same customer who ordered them. Are there any limitations on your conclusions, or any angles you haven’t considered? You could go as far in depth as going into the states and looking up certain cities, but I feel as though going by the state is a better way because there would be way to many cities to search through.
Clearly communicate your findings to stakeholders There are 7 out 9 products on this list that are above a return frequency of 10% which is an exceedingly high percentage for 7 products, but also the BAS-48-1 C at a 22% is extremely high and may need more attention than the others. I would investigate the reasoning of the top 3 returned products for sure to be fixed to lower these return numbers....
Similar Free PDFs

PSY108 Project Two Milestone
- 4 Pages

Scissor JACK Project TWO
- 38 Pages

PSY 211 Project Two
- 4 Pages

MAT 240 Project Two
- 8 Pages

CJ 207 Project Two
- 4 Pages

Project Two- The IT Professional
- 5 Pages

PSY 211 Project Two Template
- 3 Pages

PSY 215 Project Two Template.pptx
- 23 Pages

SPSS - SPSS project two, Ungvary
- 1 Pages

Course Project Part Two-hum200
- 2 Pages

5-2 Project Two Submission
- 9 Pages
Popular Institutions
- Tinajero National High School - Annex
- Politeknik Caltex Riau
- Yokohama City University
- SGT University
- University of Al-Qadisiyah
- Divine Word College of Vigan
- Techniek College Rotterdam
- Universidade de Santiago
- Universiti Teknologi MARA Cawangan Johor Kampus Pasir Gudang
- Poltekkes Kemenkes Yogyakarta
- Baguio City National High School
- Colegio san marcos
- preparatoria uno
- Centro de Bachillerato Tecnológico Industrial y de Servicios No. 107
- Dalian Maritime University
- Quang Trung Secondary School
- Colegio Tecnológico en Informática
- Corporación Regional de Educación Superior
- Grupo CEDVA
- Dar Al Uloom University
- Centro de Estudios Preuniversitarios de la Universidad Nacional de Ingeniería
- 上智大学
- Aakash International School, Nuna Majara
- San Felipe Neri Catholic School
- Kang Chiao International School - New Taipei City
- Misamis Occidental National High School
- Institución Educativa Escuela Normal Juan Ladrilleros
- Kolehiyo ng Pantukan
- Batanes State College
- Instituto Continental
- Sekolah Menengah Kejuruan Kesehatan Kaltara (Tarakan)
- Colegio de La Inmaculada Concepcion - Cebu


