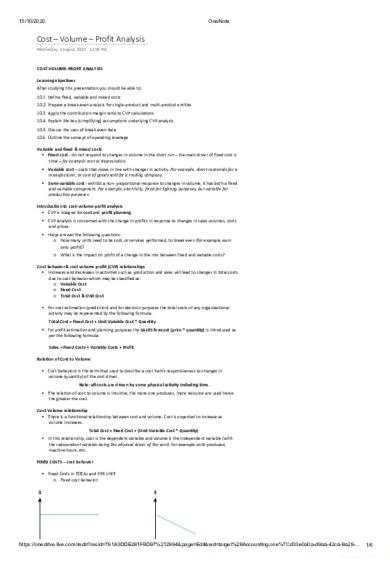
CPV notes PDF

| Title | CPV notes |
|---|---|
| Author | eden cook |
| Course | Accounting Skills for Managers |
| Institution | University of Technology Sydney |
| Pages | 6 |
| File Size | 576.4 KB |
| File Type | |
| Total Downloads | 11 |
| Total Views | 143 |
Summary
CPV notes...
Description
15/10/2020
OneNote
Cost – Volume – Profit Analysis Wednesday, 5 August 2020 12:58 PM
COST-VOLUME-PROFIT ANALYSIS Learning objectives After studying this presentation you should be able to: 10.1 Define fixed, variable and mixed costs 10.2 Prepare a break-even analysis for single-product and multi-product entities 10.3 Apply the contribution margin ratio to CVP calculations 10.4 Explain the key (simplifying) assumptions underlying CVP analysis 10.5 Discuss the uses of break-even data 10.6 Outline the concept of operating leverage Variable and fixed & mixed costs • Fixed cost - do not respond to changes in volume in the short run – the main driver of fixed cost is time – for example rent or depreciation. • Variable cost – costs that move in line with changes in activity. For example, direct materials for a manufacturer, or cost of goods sold for a trading company. • Semi-variable cost - exhibit a non- proportional response to changes in volume, it has both a fixed and variable component. For example, electricity, fixed for lighting purposes, but variable for production purposes Introduction to cost-volume-profit analysis • CVP is integral for cost and profit planning. • CVP analysis is concerned with the change in profits in response to changes in sales volumes, costs and prices. • Helps answer the following questions: ○ How many units need to be sold, or services performed, to break even (for example, earn zero profit)? ○ What is the impact on profit of a change in the mix between fixed and variable costs? Cost behavior & cost volume profit (CVP) relationships • Increases and decreases in activities such as production and sales will lead to changes in total costs due to cost behavior which may be classified as: ○ Variable Cost ○ Fixed Cost ○ Total Cost & Unit Cost • For cost estimation (prediction) and for decision purposes the total costs of any organizational activity may be represented by the following formula: Total Cost = Fixed Cost + Unit Variable Cost * Quantity • for profit estimation and planning purposes the SALES forecast (price * quantity) is introduced as per the following formula: Sales = Fixed Costs + Variable Costs + Profit Relation of Cost to Volume • Cost behaviour is the term that used to describe a cost item's responsiveness to changes in volume (quantity) of the cost driver. Note: all costs are driven by some physical activity including time. • The relation of cost to volume is intuitive, the more one produces, more resource are used hence the greater the cost. Cost-Volume relationship • There is a functional relationship between cost and volume. Cost is expected to increase as volume increases. Total Cost = Fixed Cost + (Unit Variable Cost * Quantity) • In this relationship, cost is the dependent variable and volume is the independent variable (with the independent variable being the physical driver of the cost). For example units produced, machine hours, etc. FIXED COSTS – cost behavior • Fixed Costs in TOTAL and PER UNIT ○ Fixed cost behavior:
https://onedrive.live.com/redir?resid=791A3DDE281F8D97%212994&page=Edit&wd=target%28Accounting.one%7Cd33e0a0a-d9aa-42ca-8a29-… 1/6
15/10/2020
OneNote
VARIABLE COSTS – cost behavior
MIXED COST – cost behavior • Mixed costs contain both a VARIABLE and FIXED element Total Cost = Fixed Cost + (Unit Variable Cost * Quantity) = $10,000 + $500Q
RELEVANT RANGE – cost behavior • The relevant range is the range of activity over which the cost behavior is assumed to be valid. • If the activity level goes outside the relevant range (above or below), then the expected behavior of costs changes and will result in fixed and variable cost changes. Break-even analysis • Break-even analysis relates to the calculation of the necessary levels of activity required in order to break even in a given period. • Break-even occurs when total revenue and total costs are equal resulting in zero profit:
• Break-even analysis involves the contribution margin concept. • TOTAL Contribution margin is calculated by deducting total variable costs from total revenue. • UNIT Contribution margin per unit can be calculated by deducting variable cost per unit from revenue per unit
Break-even analysis for a single product or service: • A sporting trip for children is being planned. The following costs have been estimated for the trip:
https://onedrive.live.com/redir?resid=791A3DDE281F8D97%212994&page=Edit&wd=target%28Accounting.one%7Cd33e0a0a-d9aa-42ca-8a29-… 2/6
15/10/2020
OneNote
BEP =
How many PLAYERS need to attend in order to earn a PROFIT of $600 for the trip?
Break even charts
https://onedrive.live.com/redir?resid=791A3DDE281F8D97%212994&page=Edit&wd=target%28Accounting.one%7Cd33e0a0a-d9aa-42ca-8a29-… 3/6
15/10/2020
OneNote
Contribution margin ratio • The contribution margin ratio can be express in 2 ways: ○ the percentage by which revenue exceeds VC. ○ the CM expressed as a percentage of revenue. • The Contribution Margin Ratio is the same whether irrespective of quantity over the RELEVANT RANGE.
Multi-product – Profit modelling • Most companies produce or sell many products. Multiple products make using cost volume profit analysis more complex. • All variables used in the CVP equation must be “weighted” by the ratio of sales. This is the percentage of total unit sales of each product. For example, to calculate the breakeven point in units: 1. Calculate the CM per unit of each product 2. Multiply CM per unit by ratio of sales 3. Add up each “weighted” CM per unit, to calculate a “weighted average” CM (CMWA) 4. Divide fixed costs by the CMWA Break even analysis – Multiple products Calculate the Break-Even point where the company sells three different products, details as follows:
https://onedrive.live.com/redir?resid=791A3DDE281F8D97%212994&page=Edit&wd=target%28Accounting.one%7Cd33e0a0a-d9aa-42ca-8a29-… 4/6
15/10/2020
OneNote
Margin of Safety • The margin of safety is the excess projected (or actual) sales units over the breakeven unit sales level.
• For example, if the actual (sales) level of activity is 1000 units, and the breakeven point is 750 units, the margin of safety is 250 units. Sales volume can drop 25 percent before the firm incurs a loss • Margin of safety can also be calculated using Sales Revenue($). For example, if the actual sales revenue is $10,000, and the breakeven point $Revenue is $7,500 units, the margin of safety is $2,500 units. Sales REVENUE can drop 25 percent before the firm incurs a loss. CVP assumptions • • • • •
The behavior of costs can be neatly classified as fixed or variable. Cost behavior is linear (draw with straight lines). Fixed costs remain ‘fixed’ over the time period and/or a given range of activity. Unit price and cost data remain constant over the time period and relevant range. For multi-product entities, the sales mix between the products is constant
Using break even data • Break-even data can be used to assist with a variety of decision situations, including: ○ Identifying the number of products or services required to be sold to meet break-even or profit targets.
https://onedrive.live.com/redir?resid=791A3DDE281F8D97%212994&page=Edit&wd=target%28Accounting.one%7Cd33e0a0a-d9aa-42ca-8a29-… 5/6
15/10/2020
OneNote ○ Planning products and allocating resources by focusing on those products that contribute more to profitability. ○ Determining the impact on profit of changes in the mix of fixed and variable costs. ○ Pricing products
Operating Leverage • Operating leverage (or capital intensity) is the extent to which an organization uses fixed costs in its cost structure, relative to variable costs. The greater the proportion of fixed costs in a firm’s cost structure, the greater the impact on profit from a given percentage change in sales revenue. • At a particular sales volume, a firm’s operating leverage factor can be calculated as follows:
• Assume that total contribution margin is $25,000 and net profit is $10,000 then the firms operating leverage would be 2.5. • That if sales increase by 10% net profit would increase by 25% from $10,000 to $12,500 Summary • CVP analysis is an important part of the planning process and serves as a useful decision-making tool. • An understanding of fixed, variable and mixed costs is necessary to execute break-even analysis. • Break-even analysis can be conducted for single-product/service entities and multiproduct/service entities. • The concepts of margin of safety and operating leverage provide businesses with useful extensions to the basic CVP analysis and break-even calculations
https://onedrive.live.com/redir?resid=791A3DDE281F8D97%212994&page=Edit&wd=target%28Accounting.one%7Cd33e0a0a-d9aa-42ca-8a29-… 6/6...
Similar Free PDFs
Popular Institutions
- Tinajero National High School - Annex
- Politeknik Caltex Riau
- Yokohama City University
- SGT University
- University of Al-Qadisiyah
- Divine Word College of Vigan
- Techniek College Rotterdam
- Universidade de Santiago
- Universiti Teknologi MARA Cawangan Johor Kampus Pasir Gudang
- Poltekkes Kemenkes Yogyakarta
- Baguio City National High School
- Colegio san marcos
- preparatoria uno
- Centro de Bachillerato Tecnológico Industrial y de Servicios No. 107
- Dalian Maritime University
- Quang Trung Secondary School
- Colegio Tecnológico en Informática
- Corporación Regional de Educación Superior
- Grupo CEDVA
- Dar Al Uloom University
- Centro de Estudios Preuniversitarios de la Universidad Nacional de Ingeniería
- 上智大学
- Aakash International School, Nuna Majara
- San Felipe Neri Catholic School
- Kang Chiao International School - New Taipei City
- Misamis Occidental National High School
- Institución Educativa Escuela Normal Juan Ladrilleros
- Kolehiyo ng Pantukan
- Batanes State College
- Instituto Continental
- Sekolah Menengah Kejuruan Kesehatan Kaltara (Tarakan)
- Colegio de La Inmaculada Concepcion - Cebu


