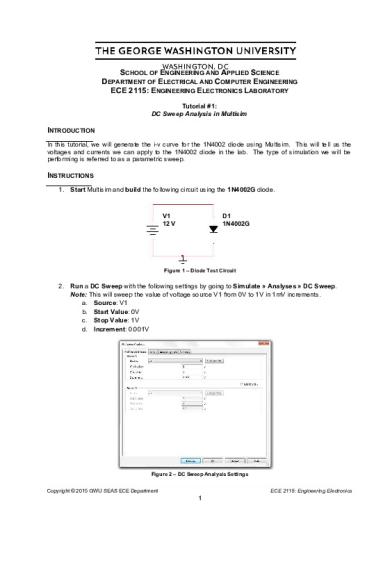
DC Sweep Diode PDF

| Title | DC Sweep Diode |
|---|---|
| Course | Engineering Electronics |
| Institution | George Washington University |
| Pages | 3 |
| File Size | 310 KB |
| File Type | |
| Total Downloads | 4 |
| Total Views | 154 |
Summary
ENGINEERING ELECTRONICS LABORATORY ...
Description
SCHOOL OF ENGINEERING AND APPLIED SCIENCE DEPARTMENT OF ELECTRICAL AND COMPUTER ENGINEERING ECE 2115: ENGINEERING ELECTRONICS LABORATORY Tutorial #1: DC Sweep Analysis in Multisim
INTRODUCTION In this tutorial, we will generate the i-v curve for the 1N4002 diode using Multisim. This will tell us the voltages and currents we can apply to the 1N4002 diode in the lab. The type of simulation we will be performing is referred to as a parametric sweep.
INSTRUCTIONS 1. Start Multisim and build the following circuit using the 1N4002G diode.
V1 12 V
D1 1N4002G
Figure 1 – Diode Test Circuit
2. Run a DC Sweep with the following settings by going to Simulate » Analyses » DC Sweep. Note: This will sweep the value of voltage source V1 from 0V to 1V in 1mV increments. a. Source: V1 b. Start Value: 0V c. Stop Value: 1V d. Increment: 0.001V
Figure 2 – DC Sweep Analysis Settings Copyright © 2015 GWU SEAS ECE Department
ECE 2115: Engineering Electronics
1
SEAS Tutorial #1: DC Sweep Analysis in Multisim
3. You should now have a typical diode i-v curve on the screen as seen below.
Figure 3 – Classic Diode i-v Curve
4. Interpret the results. Use the cursors to determine the voltage when the current equals 50mA. a. Go to Cursors » Show Cursors to show the cursors. b. Go to Cursors » Set Y Value >= to set the cursor to a specific Y value (0.05A) c. Read the corresponding X value, which should be 724.0149mV in this case. Note: This means that there was a voltage drop of roughly 724mV when 50mA was flowing through the diode. 5. Plot the Reverse Bias Current. a. The plot above shows the forward i-v characteristic for the diode. b. To find the reverse i-v characteristic, simply choose a negative start value for the swept voltage. c. Set the Start Value to -101V and run the simulation again. The graph below should appear.
Figure 4 – Reverse i-v Characteristic for -101V to 1V Copyright © 2015 GWU SEAS ECE Department
ECE 2115: Engineering Electronics
2
SEAS Tutorial #1: DC Sweep Analysis in Multisim
6. The reverse i-v characteristic is dependent upon the peak reverse voltage of the specific diode. For the 1N4002, the peak reverse voltage is roughly 100V, which is why -101V was chosen. For another diode, this value will be different. The peak reverse voltage can be found in the specification sheet for any diode. 7. To refine the graph of the reverse i-v characteristic and get a more useful picture of the diode’s behavior, we can limit the y-axis to only show values from -1A to 1A. a. Right-click on the y-axis of the above graph to bring up the axis properties. b. Set the Min to -1. c. Set the Max to 1.
Figure 5 – Complete i-v Characteristic for 1N4002 Diode from -1A to 1A
8. Compare the full graph above to the specification sheet for the 1N4002 diode. a. Forward Voltage: VFM = 1.0V @ IF = 1.0A (see chart below) b. Reverse Voltage: VR = 100V c. These two values are shown on the cursor output to the right: i. When ID = -1A, VD = -100.4763V ii. When ID = 1A, VD = 905.4973mV Note: These values line up closely with the manufacturer’s specs!
Figure 6 – Excerpted Table from 1N4002 Specification Sheet Copyright © 2015 GWU SEAS ECE Department
ECE 2115: Engineering Electronics
3...
Similar Free PDFs

DC Sweep Diode
- 3 Pages

Convertidor dc-dc
- 12 Pages

Convertidor DC-DC Reductor
- 13 Pages

GENERATOR DC GENERATOR DC
- 36 Pages

Convertidor DC-DC “cuk”
- 12 Pages

2. Zener Diode
- 5 Pages

Assignment#1( Diode)
- 6 Pages

MOTOR DC Pengertian Motor DC
- 22 Pages

Conversores AC-AC DC-DC
- 9 Pages

02 Convertidores DC-DC Cuaderno
- 48 Pages

MOTOR DC Pengertian Motor DC
- 25 Pages

1n4001 - diode specification
- 5 Pages

Diode junction capacitance
- 4 Pages

Diode equivalent circuit
- 5 Pages
Popular Institutions
- Tinajero National High School - Annex
- Politeknik Caltex Riau
- Yokohama City University
- SGT University
- University of Al-Qadisiyah
- Divine Word College of Vigan
- Techniek College Rotterdam
- Universidade de Santiago
- Universiti Teknologi MARA Cawangan Johor Kampus Pasir Gudang
- Poltekkes Kemenkes Yogyakarta
- Baguio City National High School
- Colegio san marcos
- preparatoria uno
- Centro de Bachillerato Tecnológico Industrial y de Servicios No. 107
- Dalian Maritime University
- Quang Trung Secondary School
- Colegio Tecnológico en Informática
- Corporación Regional de Educación Superior
- Grupo CEDVA
- Dar Al Uloom University
- Centro de Estudios Preuniversitarios de la Universidad Nacional de Ingeniería
- 上智大学
- Aakash International School, Nuna Majara
- San Felipe Neri Catholic School
- Kang Chiao International School - New Taipei City
- Misamis Occidental National High School
- Institución Educativa Escuela Normal Juan Ladrilleros
- Kolehiyo ng Pantukan
- Batanes State College
- Instituto Continental
- Sekolah Menengah Kejuruan Kesehatan Kaltara (Tarakan)
- Colegio de La Inmaculada Concepcion - Cebu

