FINM2401 - Notes PDF

| Title | FINM2401 - Notes |
|---|---|
| Author | Zachary Cluff |
| Course | Financial Management |
| Institution | University of Queensland |
| Pages | 34 |
| File Size | 1.6 MB |
| File Type | |
| Total Downloads | 52 |
| Total Views | 140 |
Summary
Download FINM2401 - Notes PDF
Description
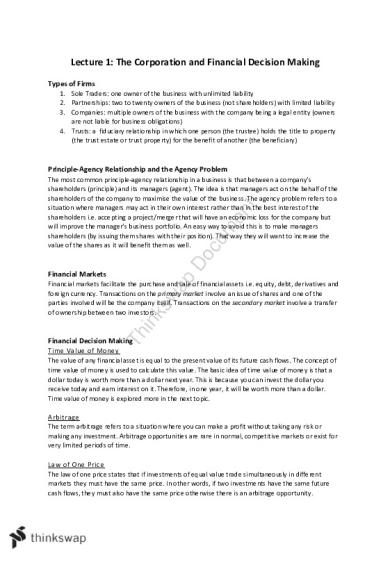
Lecture 1: The Corporation and Financial Decision Making Types of Firms 1. Sole Traders: one owner of the business with unlimited liability 2. Partnerships: two to twenty owners of the business (not shareholders) with limited liability 3. Companies: multiple owners of the business with the company being a legal entity (owners are not liable for business obligations) 4. Trusts: a fiduciary relationship in which one person (the trustee) holds the title to property (the trust estate or trust property) for the benefit of another (the beneficiary)
Principle-Agency Relationship and the Agency Problem The most common principle-agency relationship in a business is that between a company’s shareholders (principle) and its managers (agent). The idea is that managers act on the behalf of the shareholders of the company to maximise the value of the business. The agency problem refers to a situation where managers may act in their own interest rather than in the best interest of the shareholders i.e. accepting a project/merger that will have an economic loss for the company but will improve the manager’s business portfolio. An easy way to avoid this is to make managers shareholders (by issuing them shares with their position). That way they will want to increase the value of the shares as it will benefit them as well.
Financial Markets Financial markets facilitate the purchase and sale of financial assets i.e. equity, debt, derivatives and foreign currency. Transactions on the primary market involve an issue of shares and one of the parties involved will be the company itself. Transactions on the secondary market involve a transfer of ownership between two investors.
Financial Decision Making Time Value of Money The value of any financial asset is equal to the present value of its future cash flows. The concept of time value of money is used to calculate this value. The basic idea of time value of money is that a dollar today is worth more than a dollar next year. This is because you can invest the dollar you receive today and earn interest on it. Therefore, in one year, it will be worth more than a dollar. Time value of money is explored more in the next topic. Arbitrage The term arbitrage refers to a situation where you can make a profit without taking any risk or making any investment. Arbitrage opportunities are rare in normal, competitive markets or exist for very limited periods of time. Law of One Price The law of one price states that if investments of equal value trade simultaneously in different markets they must have the same price. In other words, if two investments have the same future cash flows, they must also have the same price otherwise there is an arbitrage opportunity.
Example Investment A B C
Year 1 $25 $30 $55
Year 2 $25 $20 $45
Year 3 $25 $10 $35
Say the above investments exist with the following cash flows over the next three years. We can see from the table that the cash flows of Investment C are equivalent to the cash flows of Investment A + Investment B. Therefore:
Now assume Investment A sells for $70 and Investment B sells for $55. The value of Investment C should be $125 (70 + 55) as this is its fair value. If Investment C sells for anything other than $125, there is an arbitrage opportunity. Consider the following scenarios: Investment C sells for $120 or $135. How can you profit from this arbitrage opportunity? Investment C sells for $120 (under-priced) We know that Investment C should sell for $125; therefore it is under-priced on the market. Whenever a financial asset is under-priced, you will need to buy it then sell it when the price has returned to its accurate value to make a profit. In this case, we can buy Investment C and sell Investments A and B separately. This results in a profit of $5. Action Cash Flows Buy Investment C -$120 Sell Investment A +$70 Sell Investment B +55 +$5 Net Cash Flows Investment C sells for $135 (overpriced) We know that Investment C should sell for $125; therefore it is overpriced on the market. Whenever a financial asset is overpriced, you will need to sell it. In this case, we can buy Investment A and B separately then sell Investment C. This results in a profit of $10. Action Cash Flows Buy Investment A -$70 Buy Investment B -$55 Sell Investment C +$135 +$10 Net Cash Flows
—END OF TOPIC—
Lecture 2: Time Value of Money As described in Lecture 1, the basic idea of time value of money is that a dollar today is worth more than a dollar next year because you can invest the dollar you receive today and earn interest on it. Assume you have two options: 1. Receive $1 today, or 2. Receive $1 next year. Which option is more valuable? If you take $1 today, you can invest it and earn interest (say 5%) on that money. So it is beneficial to take the $1 today because in one year that $1 has increased in value to $1.05 which is greater than the second option.
Present and Future Values Future Value Calculating future values is usually used to determine the balance of a savings account at some point in the future. In the below equation, r is the interest rate on the account and n is the number of periods until the future date.
Example: Fut ure Value Say you deposit $5 in a savings account with 5% interest compounding annually. How much will be in the account after 3 years (assuming no further contributions)?
If interest compounds semi-annually, how much interest will be in the accounting after 3 years? If interest compounds semi-annually, the interest rate and time periods (n) must be in semi-annual terms (n becomes 6 because there will be 6 semi-annual periods):
Present Value Calculating present values is used to determine how much money you need to save today in order to have a certain amount in the future. This calculation is also used to determine the value of financial assets, the present value of future cash flows.
Example: Present Value Say you wish to save for a guitar which will cost $200 in two years. How much must you invest in a 3% savings account that compounds semi-annually to be able to buy the guitar in two years?
Looking at the two equations, you can see that they are simply a rearrangement of each other. If you would like to check your calculation, you can look at the question the other way around i.e. if you invest $188.43 in a savings account with 3% interest compounded semi-annually, how much will you have in two years?
Value of Multiple Cash Flows Example: Fut ure Value of Multiple Cash Flows Find the future value of the below cash flows at year 3 (after you have received the $500), assuming you will deposit the cash into your savings account at the beginning of the year and the interest rate is 5%, compounding semi-annually. Time CF
Year 1 $300
Year 2 $290
Year 3 $500
Year 4 $580
Remember, the future value calculation determines the value of cash flows at some point in the future. For this question, you need to find the value of the cash flows in year 3.
NOTE: The appropriate rate is 2.5% as the account compounds interest semi-annually. You also need to count the number of semi-annual time periods that occur from when you receive the money to the future date (year 3). The $500 received in year 3 does not need to be discounted as it would not have gained interest. The last cash flow (year 4) is also not included as you would not have received it in year 3. Example: Present Value of Multip le Cash Flows Using the same cash flows as above, calculate their present value (value today) assuming you are trying to determine the value of an investment that will produce these cash flows. Use the same interest rate and compounding periods.
NOTE: Again, the time periods are in semi-annual form i.e. there are 6 semi-annual periods from today until you will receive $500 from the investment.
Annuities Present Value of Annuities An annuity is a finite number of equal cash flows that are evenly spaced out. For annuities, n represents the number of cash flows you receive. Type of Annuity
Description
Ordinary Annuity
Equal time between now and CF1 as every subsequent CF
Calculation
CF1 is immediate and all subsequent CFs are delivered within equal time frames
Annuity Due
Deferred Annuity
An annuity that occurs at some point in the future where m represents the number of periods until the annuity begins
NOTE: This course mainly focuses on present value annuities but if you need to calculate future value annuities (unlikely), the ordinary future value annuity is:
Present Value of P erpetuities A perpetuity is a series of equal cash flows that are evenly spaced out and continue forever. Type of Perpetuity
Calculation
Ordinary Perpetuity Perpetuity Due Deferred Perpetuity Growing Perpetuities: when the amount of the perpetuity increases at a constant rate (g)
NOTE: Perpetuities are annuities that continue forever, therefore n = ∞ and anything to the power of ∞ = 1.
—END OF TOPIC—
Lecture 3 & 4: Interest Rates and Valuing Bonds Nominal and Real Interest Rates Nominal (rn): rates used for discounting or compounding cash flows Real (rr): rate of growth of your purchasing power after adjusting for inflation Inflation (i): increase in price over a period of time
Interest Rate for Time Value of Money For time value of money calculations, n and r must be expressed in the same time frame e.g. if n is in years, r must be an annual rate. The same concept is applicable to annuity and perpetuity calculations where n and r must be expressed in the same time as the period between each cash flow e.g. receiving cash flows each month, r must be a monthly rate and n must be in terms of months. So how do you convert r from an annual rate to a monthly rate? Simply divide the annual rate by 12. Annual Percentage Rate (APR) This is the annual nominal rate quoted by the financial institution (% p.a.). The periodic rate is the interest rate applied per compounding period which is what you would need to use when calculating PV and FV for investments with multiple compounding periods per year. APR = period rate * number of periods. e.g. 12% p.a. compounding monthly: APR = 12%, Periodic rate = 1% (12/12). Therefore r = 1% in your calculation for PV/FV because this is the monthly rate. Effective Annual Rate (EAR) This is the actual rate paid/received after accounting for compounding (rate of growth). EAR can be used to compare two investments with different compounding periods. In the below equation, k is the number of compounding periods per year.
Example: AP R, EAR a nd comparing investments Suppose you have two investment options that have the same cash flows but different interest rates and compounding periods: 5% p.a. with monthly compound, or 5.5% p.a. with quarterly compounding. Which investment would provide you with the greatest return? As these two investments have different compounding periods, you can only compare their rates if they are in the form of EAR. Remember that the %p.a. is the APR.
Now the two rates are comparable. If you are receiving money and wanting to save, you will choose the investment with the highest EAR (Investment 2) whereas if you are paying off debt, you will choose the investment with the lowest EAR (Investment 1).
Valuation of Debt Instruments Debt instruments allow firms to borrow money from investors to raise funds for operation. The Australian debt market is divided into: The Cash Market: short term borrowing (overnight interbank market), maturity is 24 hours The Money Market: short term securities i.e. Treasury notes The Fixed Interest Market: trades securities issued by the Commonwealth, government and corporations This course focuses on two types of debt instruments: coupon bonds and zero-coupon bonds. Coupon Bonds A coupon bond is where the borrower agrees to pay the lender cash (coupons) each period and repay the principal (face value) when the bond matures. The coupon payment (C) is determined by the periodic coupon rate (c) and the face value of the bond (F):
The face value of a coupon bond is quoted as $100 so if a bond has a face value of $100,000 and a price of $95, its actual value is 95% of $100,000. Most coupons are paid semi-annually and if not specified in a question, assume it is paid semi-annually. NOTE: The receipt of coupon payments is seen as a cash flow, therefore, the bond can be valued using the annuity calculations we completed in the previous topic. In the below equation, rd is the yield (discount rate) of the bond.
Zero-Coupon Bonds As a zero-coupon bond does not pay coupons, the only cash flow associated with the bond is the receipt of the face value at the maturity date. These instruments are usually priced below their face value and the difference between the price and face value represents the interest accrued.
—END OF TOPIC—
Lecture 5: Investment Decision Rules The NPV Rule In determining whether to accept or reject a project using NPV analysis, we apply the NPV decision rule where projects with positive NPV’s are accepted and those with negative NPV’s are rejected. The NPV of a project will depend on the discount rate, the lower the discount rate the greater chance of having a positive NPV. When choosing between mutually exclusive projects (only one can be accepted) you must choose the project with the highest NPV. Example: Stand Alone Projects You are considering an investment in a pizza business that requires an initial cost of $10,000 and will produce a cash inflow of $4,000 in perpetuity with a cost of capital of 5%. Should you accept this project?
Therefore you should accept this project as the NPV is positive. Example: Mutua lly Exclusive Projects You are trying to decide which project to purchase. The cash flows to each are represented below. The projects are mutually exclusive, if the cost of capital is 5%, which project should you accept? Year 0 1 2 Project A -3,000 1,000 2,000 Project B -2,000 700 1,300
Because both projects have negative NPV’s you would reject both of them. If for some reason you had to go through with one of them, you would choose Project B as it has a smaller loss. Projects with Different Lives When comparing project with different lives, you must use the annual equivalent cash flow equation to determine which project will add the most value. The project with the highest AE should be accepted.
Example: Mutua lly Exclusive Projects with Different Lives Machine A has an NPV of 2,000 and a life of 3 years while Machine B has a NPV of 3,000 and life of 5 years, which machine should be purchased if the required return is 10%?
Because Machine A has the highest AE, it should be purchased rather than Machine B.
Internal Rate of Return Other than the NPV rule, the IRR rule is also used in project evaluations. This will sometimes provide the same result as the NPV rule but when they do conflict, the NPV decision should be followed. The IRR is the interest rate that makes NPV zero. The IRR rules states that if the IRR is greater than the cost of capital, the project should be accepted. If you look at the first example, the IRR for the pizza business would be:
To check this, simply sub the r = 0.4 into the equation:
The cost of capital in the example was 5% which is less than the IRR of 40%. Therefore, if we were using the IRR rule, we would accept the project which is the same decision we came to by using the NPV rule. In some cases, there may be multiple or even nonexistent IRR in which case using the IRR rule becomes difficult.
—END OF TOPIC—
Lecture 6: Capital Budgeting For Capital Budgeting, you are only concerned with Free Cash Flow (FCF) associated with the project. This is the difference between the firm’s cash flow if the project is undertaken and if it’s not. Relevant cash flows include: Revenues, expenses, capital expenditure, depreciation associated with the project Irrelevant cash flows include: Sunk costs (costs that have already been incurred and will not change if the project is taken or not)
OR
Table Calculation of Free Cash Flows Revenue
Any Income
Less Operating Expenses
Any expenses: maintenance, utilities etc.
Less/Add Opportunity Cost
Less revenue lost or add discounts received by accepting project
Less Depreciation
= (Cost – Salvage Value) / Useful Life
= EBIT
Earnings Before Interest and Tax
Less Income Tax
= EBIT * Tax Rate
= Unlevered Net Income
= EBIT – (EBIT * Tax Rate) = EBIT * (1 – t)
Add Back Depreciation
As it is a Non-Cash Expense (it is only used above to calculate EBIT)
Less Capital Expenditure
= Cost of PPE (i.e. Non-Current Assets)
Add Cash from Sale
Cash received when PPE is sold at the end of the project
Less Tax on Gain
= (Cash from Sale – Book Value) * Tax Rate
Less ∆Net Working Capital
i.e. change in Inventory + change in A/cs Receivable – change in A/cs Payable
= FCF Externalities must also be considered. These are indirect effects of the project that may affect the profits of other activities of the firm. There are two types: Cannibalisation: sales of a new product replace sales of an existing product (therefore, you must subtract sales of the old product that you will no longer receive)
Side Effects: costs of another product are reduced due to the new project (therefore, you must add back the costs that you will not have to pay due to the new product; this is a benefit)
Opportunity Costs This is something a few people struggle with. The opportunity cost we think about here is anything that will change the already existing costs to or revenue from the company. Say you currently own a car that you could sell for $15,000. The project you are evaluating is for a new pizza restaurant and you would need to use the car for deliveries. Therefore, you are giving up the $15,000 of revenue you could receive from selling the car. This is an opportunity cost as you are losing revenue due to the project. Because it is a cost, you would subtract the revenue you are forgoing. Now assume you have started this restaurant and are thinking of opening another one across town. Your electricity company has a deal for small businesses where you can receive a $200 discount per store if you own two or more stores. This is an opportunity cost as opening the second store can reduce the costs of your existing restaurant. As this is a benefit, you will add back the $200 (the discount for the second store will be displayed in the costs section of its analysis.
Change in Net Working Capital It is rare that you have to calculate the change in net working capital but I’ll provide an example just in case. The best way to do this is simply compare the net working capital from one period with the next. If NWC increased, that means we bought inventory, sold on credit or paid back a supplier. Buying inventory and paying a supplier are clear examples of cash outflows but the reason selling on credit is an “outflow” is because it wasn’t a cash flow when included in sales and therefore must be considered as an outflow to cancel out the amount it is connected to in sales. If NWC decreases, that means inventory is sold, cash is received from customers or we buy on credit. Again, buying on credit is an “inflow” to cancel out the cost that would have been recorded. Example: Net Working Capit al Say you currently have an inventory balance of $20,000, A/cs Receivable is $10,000 and A/cs Payable is $3,000. To commence your project, you will need additiona...
Similar Free PDFs
Popular Institutions
- Tinajero National High School - Annex
- Politeknik Caltex Riau
- Yokohama City University
- SGT University
- University of Al-Qadisiyah
- Divine Word College of Vigan
- Techniek College Rotterdam
- Universidade de Santiago
- Universiti Teknologi MARA Cawangan Johor Kampus Pasir Gudang
- Poltekkes Kemenkes Yogyakarta
- Baguio City National High School
- Colegio san marcos
- preparatoria uno
- Centro de Bachillerato Tecnológico Industrial y de Servicios No. 107
- Dalian Maritime University
- Quang Trung Secondary School
- Colegio Tecnológico en Informática
- Corporación Regional de Educación Superior
- Grupo CEDVA
- Dar Al Uloom University
- Centro de Estudios Preuniversitarios de la Universidad Nacional de Ingeniería
- 上智大学
- Aakash International School, Nuna Majara
- San Felipe Neri Catholic School
- Kang Chiao International School - New Taipei City
- Misamis Occidental National High School
- Institución Educativa Escuela Normal Juan Ladrilleros
- Kolehiyo ng Pantukan
- Batanes State College
- Instituto Continental
- Sekolah Menengah Kejuruan Kesehatan Kaltara (Tarakan)
- Colegio de La Inmaculada Concepcion - Cebu


