S-N Curve for Torsional Shear PDF

| Title | S-N Curve for Torsional Shear |
|---|---|
| Author | Muhammad Adnan Manzo CUSTPk/ |
| Course | Mechanics of Machine |
| Institution | Capital University of Science and Technology |
| Pages | 6 |
| File Size | 380.6 KB |
| File Type | |
| Total Downloads | 21 |
| Total Views | 126 |
Summary
Download S-N Curve for Torsional Shear PDF
Description
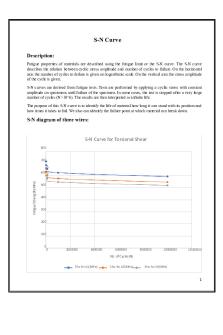
S-N Curve Description: Fatigue properties of materials are described using the fatigue limit or the S-N curve. The S-N curve describes the relation between cyclic stress amplitude and number of cycles to failure. On the horizontal axis the number of cycles to failure is given on logarithmic scale. On the vertical axis the stress amplitude of the cycle is given. S-N curves are derived from fatigue tests. Tests are performed by applying a cyclic stress with constant amplitude on specimens until failure of the specimen. In some cases, the test is stopped after a very large number of cycles (N>10^6). The results are then interpreted as infinite life. The purpose of this S-N curve is to identify the life of material how long it can stand with its position and how times it takes to fail. We also can identify the failure point at which material can break down.
S-N diagram of three wires:
S-N Curve for Torsional Shear 800
700
Fatgue Strength(MPa)
600
500
400
300
200
100
0 0
2000000
4000000
6000000
8000000
10000000
12000000
No. of Cycles(N) Sfw for D1(MPa)
Sfw for D2(MPa)
Sfw for D3(MPa)
1
Wire1 Diameter: Sfw(dia1) 800
Fatgue Strength sfw(MPa)
700 600 500 400 300 200 100 0 0
2000000
4000000
6000000
8000000
10000000
12000000
8000000
10000000
12000000
No. of Cycles(N)
Wire2 Diameter: Sfw(dia2) 700
Fatgue Strength sfw(MPa)
600 500 400 300 200 100 0
0
2000000
4000000
6000000
No. of Cycles(N)
2
Wire3 Diameter: Sfw(dia3) 700
Fatgue Strength Sfw(MPa)
600
500
400 300
200
100
0
0
2000000
4000000
6000000
8000000
10000000
12000000
No. of Cycles(N)
Equations and Calculations: For finding fatigue strength of different diameter of (chrome vanadium) wire, for this first, I find S ut, Sut = Adb For this A and b value I used table 14.4 (A232) For different three diameter I find three values of Sut, Diameter (4.033mm) wire Sut = 1559.59 MPa Diameter (7.033mm) wire Sut = 1438.537 MPa Diameter (10.033mm) wire Sut = 1366.163 MPa And, for Sms = 0.6*Sut Diameter (4.033mm) wire Sms = 935.754 MPa Diameter (7.033mm) wire Sms = 863.122 MPa Diameter (10.033mm) wire Sms = 819.697 MPa And for Fatigue strength of (Chrome v) wire, For life cycle 103 Sfw = 0.46*Sut For life cycle 104 Sfw = 0.44*Sut 3
For life cycle 105 Sfw = 0.42*Sut For life cycle 106 Sfw = 0.40*Sut For life cycle 107 Sfw = 0.38*Sut
Comments: 1. From this I concluded that by increasing the diameter of wire, fatigue strength also increases. Fatigue strength depends on diameter of wire. 2. As we noticed form the diagram that at same number of cycles with different diameter have different fatigue strength value and with greater diameter have largest value than smaller diameter wires.
3. And as in this diagram it is a numerically solution (S- N diagram) but in actual there is a larger number of cycles are applied to achieve their S–N diagram.
Reference: 1. https://www.fatec-engineering.com/2018/02/20/description-of-a-s-n-curve/
4
Paper Work Calculations:
5
6...
Similar Free PDFs

S-N Curve for Torsional Shear
- 6 Pages

Torsional Pendulum
- 23 Pages

SN teaching
- 27 Pages

Streedhan SN
- 1 Pages

SN 14 Síndromes Medulares
- 4 Pages

Kompensacja rownolegla SN
- 3 Pages

Shear stress in fluids
- 2 Pages

Direct shear test - Lab
- 13 Pages

Shear Box Lab Report
- 10 Pages

Resumen Celulas SN
- 5 Pages

Exercícios SN - sistema nervoso
- 3 Pages

Aula prática anatomia SN
- 5 Pages

Direct Shear Test Report
- 6 Pages

CHEM 351 F14 SN practice
- 1 Pages
Popular Institutions
- Tinajero National High School - Annex
- Politeknik Caltex Riau
- Yokohama City University
- SGT University
- University of Al-Qadisiyah
- Divine Word College of Vigan
- Techniek College Rotterdam
- Universidade de Santiago
- Universiti Teknologi MARA Cawangan Johor Kampus Pasir Gudang
- Poltekkes Kemenkes Yogyakarta
- Baguio City National High School
- Colegio san marcos
- preparatoria uno
- Centro de Bachillerato Tecnológico Industrial y de Servicios No. 107
- Dalian Maritime University
- Quang Trung Secondary School
- Colegio Tecnológico en Informática
- Corporación Regional de Educación Superior
- Grupo CEDVA
- Dar Al Uloom University
- Centro de Estudios Preuniversitarios de la Universidad Nacional de Ingeniería
- 上智大学
- Aakash International School, Nuna Majara
- San Felipe Neri Catholic School
- Kang Chiao International School - New Taipei City
- Misamis Occidental National High School
- Institución Educativa Escuela Normal Juan Ladrilleros
- Kolehiyo ng Pantukan
- Batanes State College
- Instituto Continental
- Sekolah Menengah Kejuruan Kesehatan Kaltara (Tarakan)
- Colegio de La Inmaculada Concepcion - Cebu

