Topic 11- Cost Behavior and Decisions Using C-V-P Analysis PDF

| Title | Topic 11- Cost Behavior and Decisions Using C-V-P Analysis |
|---|---|
| Author | Mohini Gomez |
| Course | Accounting for Decision Makers |
| Institution | Western Governors University |
| Pages | 4 |
| File Size | 134 KB |
| File Type | |
| Total Downloads | 21 |
| Total Views | 129 |
Summary
Chapter Summary...
Description
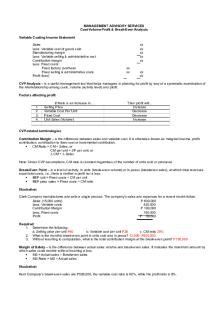
Review of Key Points Understand the key factors involved in cost-volumeprofit (C-V-P) analysis and why it is such an important tool in management decision making. Key Factors in CVP Analysis
Depends on
Sales Revenue
• Number of units sold • Selling price per unit • Mix of items sold
Variable Cost
• Number of units sold • Variable cost per unit • Mix of items sold
Fixed Cost
• Management choice of the level of fixed costs; does NOT depend on the number of units sold
Profit
• Sales revenue - Variable cost - Fixed cost
Explain and analyze the basic cost behavior patterns— variable, fixed, and mixed. Variable cost: variable in total, fixed per unit Fixed cost: fixed in total, variable per unit Stepped cost: increases with the level of activity but in steps instead of smoothly. If the steps are wide, the cost is treated as a fixed cost; if the steps are narrow, the cost is approximated as a variable cost. Mixed costs have both a fixed and a variable component.
Analyze mixed costs using the scattergraph and highlow methods. Before mixed costs can be analyzed and used in decision making, they must be divided into their fixed and variable components. The scattergraph and high-low methods are commonly used to analyze mixed costs. The scattergraph method involves visually plotting a straight line (the regression line) through points on a graph of cost data at various activity levels. With the high-low method, the highest and lowest levels of activity and their associated costs are used to calculate the variable cost rate and the total fixed costs.
Perform C-V-P analyses, and describe the effects potential changes in C-V-P variables have on company profitability. Contribution Margin = Sales Revenue - Variable Costs Sales Revenue - Variable Costs - Fixed Costs = Target Income At breakeven, Target Income = 0 Sales Revenue = Sales Price × Number of Units Variable Costs = Variable Cost per Unit × Number of Units Variable Costs = Variable Cost Ratio × Sales Revenue
Visualize C-V-P relationships using graphs. Constructing a CVP 1. Draw the two axes with dollars on the vertical axis and units on the horizontal axis. graph 2. Draw the fixed cost line, which is a horizontal line indicating the total amount of fixe cost. 3. Draw the total cost line. This line starts on the vertical axis at the amount of fixed cos and the upward slope of the line is equal to the variable cost per unit.
4. Draw the total revenue line. This line starts at the origin ($0, 0 units), and the upward slope of the line is equal to the selling price per unit. 5. Label the break-even point. This is the point where the total revenue and total cost lin intersect. Constructing a profit graph
1. Draw the two axes with dollars on the vertical axis and units on the horizontal axis.
2. Place a point on the vertical axis equal to the loss the company will experience if it ha no sales. This loss is equal to the amount of fixed cost. 3. Place a second point, this time on the horizontal axis, indicating the number of units t company needs to sell to break even. 4. Draw a line passing through these two points. This is the profit line.
Explain the effects of sales mix on profitability. Sales mix is the proportion of revenue dollars represented by each of a company's products. Because all products do not have the same contribution margin ratios, changes in the sales mix of products sold can significantly affect total profits. When you are working as a manager to maximize profits, it is best to maintain as large a contribution margin as possible on all products and then emphasize those products with the largest individual contribution margin ratios.
Describe how higher fixed costs increase a company's operating leverage, leading to increased variability in profits as sales fluctuate. Operating leverage relates to the amount of fixed costs versus variable costs that a company has in its cost structure. High fixed costs (and low variable costs) indicate high operating leverage; low fixed costs (and high variable costs) indicate low operating leverage.
The higher the operating leverage, the more money a company loses if sales are below the break-even point, but the more money it makes if sales are above the break-even point....
Similar Free PDFs

Cost behaviour and CVP analysis
- 8 Pages

CVP Analysis - CVP
- 9 Pages

Cost Behavior - Cost Accounting
- 78 Pages

Cost Behavior and Cost Volume Profit
- 18 Pages

Activity COST AND COST Analysis
- 5 Pages
Popular Institutions
- Tinajero National High School - Annex
- Politeknik Caltex Riau
- Yokohama City University
- SGT University
- University of Al-Qadisiyah
- Divine Word College of Vigan
- Techniek College Rotterdam
- Universidade de Santiago
- Universiti Teknologi MARA Cawangan Johor Kampus Pasir Gudang
- Poltekkes Kemenkes Yogyakarta
- Baguio City National High School
- Colegio san marcos
- preparatoria uno
- Centro de Bachillerato Tecnológico Industrial y de Servicios No. 107
- Dalian Maritime University
- Quang Trung Secondary School
- Colegio Tecnológico en Informática
- Corporación Regional de Educación Superior
- Grupo CEDVA
- Dar Al Uloom University
- Centro de Estudios Preuniversitarios de la Universidad Nacional de Ingeniería
- 上智大学
- Aakash International School, Nuna Majara
- San Felipe Neri Catholic School
- Kang Chiao International School - New Taipei City
- Misamis Occidental National High School
- Institución Educativa Escuela Normal Juan Ladrilleros
- Kolehiyo ng Pantukan
- Batanes State College
- Instituto Continental
- Sekolah Menengah Kejuruan Kesehatan Kaltara (Tarakan)
- Colegio de La Inmaculada Concepcion - Cebu


