Ttable - T Table values for final PDF

| Title | Ttable - T Table values for final |
|---|---|
| Course | Business Statistics |
| Institution | University of Technology Sydney |
| Pages | 1 |
| File Size | 45.6 KB |
| File Type | |
| Total Downloads | 44 |
| Total Views | 128 |
Summary
T Table values for final...
Description
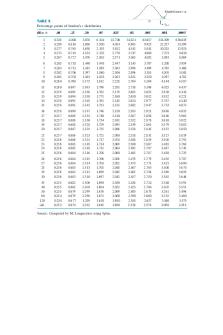
Critival Values from the t Distribution d.f. 1 2 3 4 5 6 7 8 9 10 11 12 13 14 15 16 17 18 19 20 21 22 23 24 25 26 27 28 29 30 40 50 60 70 80 90 100 150 200 Inf
0.1 3.078 1.886 1.638 1.533 1.476 1.44 1.415 1.397 1.383 1.372 1.363 1.356 1.35 1.345 1.341 1.337 1.333 1.33 1.328 1.325 1.323 1.321 1.319 1.318 1.316 1.315 1.314 1.313 1.311 1.31 1.303 1.299 1.296 1.294 1.292 1.291 1.29 1.287 1.286 1.282
Area in Upper Tail of Student-t Distribution 0.05 0.025 0.01 0.005 6.314 12.706 31.821 63.657 2.92 4.303 6.965 9.925 2.353 3.182 4.541 5.841 2.132 2.776 3.747 4.604 2.015 2.571 3.365 4.032 1.943 2.447 3.143 3.707 1.895 2.365 2.998 3.499 1.86 2.306 2.896 3.355 1.833 2.262 2.821 3.25 1.812 2.228 2.764 3.169 1.796 2.201 2.718 3.106 1.782 2.179 2.681 3.055 1.771 2.16 2.65 3.012 1.761 2.145 2.624 2.977 1.753 2.131 2.602 2.947 1.746 2.12 2.583 2.921 1.74 2.11 2.567 2.898 1.734 2.101 2.552 2.878 1.729 2.093 2.539 2.861 1.725 2.086 2.528 2.845 1.721 2.08 2.518 2.831 1.717 2.074 2.508 2.819 1.714 2.069 2.5 2.807 1.711 2.064 2.492 2.797 1.708 2.06 2.485 2.787 1.706 2.056 2.479 2.779 1.703 2.052 2.473 2.771 1.701 2.048 2.467 2.763 1.699 2.045 2.462 2.756 1.697 2.042 2.457 2.75 1.684 2.021 2.423 2.704 1.676 2.009 2.403 2.678 1.671 2 2.39 2.66 1.667 1.994 2.381 2.648 1.664 1.99 2.374 2.639 1.662 1.987 2.368 2.632 1.66 1.984 2.364 2.626 1.655 1.976 2.351 2.609 1.653 1.972 2.345 2.601 1.645 1.96 2.326 2.576
0.001 318.309 22.327 10.215 7.173 5.893 5.208 4.785 4.501 4.297 4.144 4.025 3.93 3.852 3.787 3.733 3.686 3.646 3.61 3.579 3.552 3.527 3.505 3.485 3.467 3.45 3.435 3.421 3.408 3.396 3.385 3.307 3.261 3.232 3.211 3.195 3.183 3.174 3.145 3.131 3.09...
Similar Free PDFs

T Table
- 1 Pages

T-Distribution Table - handout
- 1 Pages

Table Loi T (Student)
- 3 Pages

Student\'s t-distribution table
- 1 Pages

Songs Table for Final Exam
- 9 Pages

Jeopardy table for Final Exam
- 2 Pages

Laboratory Values for NCLEX
- 4 Pages

Z-Table - z table for stats
- 1 Pages
Popular Institutions
- Tinajero National High School - Annex
- Politeknik Caltex Riau
- Yokohama City University
- SGT University
- University of Al-Qadisiyah
- Divine Word College of Vigan
- Techniek College Rotterdam
- Universidade de Santiago
- Universiti Teknologi MARA Cawangan Johor Kampus Pasir Gudang
- Poltekkes Kemenkes Yogyakarta
- Baguio City National High School
- Colegio san marcos
- preparatoria uno
- Centro de Bachillerato Tecnológico Industrial y de Servicios No. 107
- Dalian Maritime University
- Quang Trung Secondary School
- Colegio Tecnológico en Informática
- Corporación Regional de Educación Superior
- Grupo CEDVA
- Dar Al Uloom University
- Centro de Estudios Preuniversitarios de la Universidad Nacional de Ingeniería
- 上智大学
- Aakash International School, Nuna Majara
- San Felipe Neri Catholic School
- Kang Chiao International School - New Taipei City
- Misamis Occidental National High School
- Institución Educativa Escuela Normal Juan Ladrilleros
- Kolehiyo ng Pantukan
- Batanes State College
- Instituto Continental
- Sekolah Menengah Kejuruan Kesehatan Kaltara (Tarakan)
- Colegio de La Inmaculada Concepcion - Cebu


