EC2603 Step by Step Eviews Guide for the Coursework PDF

| Title | EC2603 Step by Step Eviews Guide for the Coursework |
|---|---|
| Course | Econometrics for Finance |
| Institution | Brunel University London |
| Pages | 2 |
| File Size | 106.8 KB |
| File Type | |
| Total Downloads | 62 |
| Total Views | 120 |
Summary
Coursework...
Description
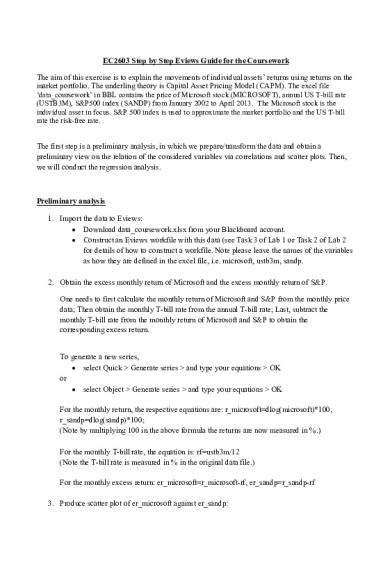
EC2603 Step by Step Eviews Guide for the Coursework The aim of this exercise is to explain the movements of individual assets’ returns using returns on the market portfolio. The underling theory is Capital Asset Pricing Model (CAPM). The excel file ‘data_coursework’ in BBL contains the price of Microsoft stock (MICROSOFT), annual US T-bill rate (USTB3M), S&P500 index (SANDP) from January 2002 to April 2013. The Microsoft stock is the individual asset in focus. S&P 500 index is used to approximate the market portfolio and the US T-bill rate the risk-free rate. The first step is a preliminary analysis, in which we prepare/transform the data and obtain a preliminary view on the relation of the considered variables via correlations and scatter plots. Then, we will conduct the regression analysis.
Preliminary analysis 1. Import the data to Eviews: Download data_coursework.xlsx from your Blackboard account. Construct an Eviews workfile with this data (see Task 3 of Lab 1 or Task 2 of Lab 2 for details of how to construct a workfile. Note please leave the names of the variables as how they are defined in the excel file, i.e. microsoft, ustb3m, sandp. 2. Obtain the excess monthly return of Microsoft and the excess monthly return of S&P. One needs to first calculate the monthly return of Microsoft and S&P from the monthly price data; Then obtain the monthly T-bill rate from the annual T-bill rate; Last, subtract the monthly T-bill rate from the monthly return of Microsoft and S&P to obtain the corresponding excess return.
To generate a new series, select Quick > Generate series > and type your equations > OK or select Object > Generate series > and type your equations > OK For the monthly return, the respective equations are: r_microsoft=dlog(microsoft)*100, r_sandp=dlog(sandp)*100; (Note by multiplying 100 in the above formula the returns are now measured in %.) For the monthly T-bill rate, the equation is: rf=ustb3m/12 (Note the T-bill rate is measured in % in the original data file.) For the monthly excess return: er_microsoft=r_microsoft-rf, er_sandp=r_sandp-rf 3. Produce scatter plot of er_microsoft against er_sandp:
In the workfile window hold down Ctrl-key and select the two series > right click and select Open Group > you get data spreadsheet for two series To plot a scatter diagram click on View > Graph > Select Basic Graph but instead of Line & Symbol select scatter > OK 4. Create the dummy variable distinguishing the period before and after the financial crisis using the group window you obtained from task 3: To get the correlation matrix for the period from January 2002 to August 2008: click on View > Covariance Analysis > untick Covariance > tick Correlation and type “2002m01 2008m08” in Sample > OK To get the correlation matrix for the period from September 2008 to April 2013: click on View > Covariance Analysis > untick Covariance > tick Correlation and type “2008m09 2013m04” in Sample> OK 5. Create the financial crisis dummy variable: Select Quick >Generate Series> type “dummy=0”> Leave “2002m01 2013m04” as Sample>OK Select Quick >Generate Series> type “dummy=1”>type “2008m09 2013m04” as Sample >OK
Regression Analysis 1. Estimate a regression model of the excess return of Microsoft on a constant and the excess return of S&P500 index: Select Quick > Equation Estimation > and type ‘er_microsoft c er_sandp’ > select method as LS > OK 2. Estimate a regression model of the excess return of Microsoft on a constant, the financial crisis dummy variable and the excess return of S&P500 index. Select Quick > Equation Estimation > and type ‘er_microsoft c er_sandp dummy’ > select method as LS > OK
3. Estimate a regression model of the excess return of Microsoft on a constant, the excess return of S&P500 index, and the product of the financial crisis dummy variable and the excess return of S&P500 index. Select Quick > Equation Estimation > and type ‘er_microsoft c er_sandp dummy*er_sandp’ > select method as LS > OK ...
Similar Free PDFs

STROWGER/STEP BY STEP SWITCH
- 1 Pages

Venue Analysis Step by Step
- 3 Pages

Sap mm configuration step by step
- 104 Pages

Convolution model Step by Step v2a
- 22 Pages
Popular Institutions
- Tinajero National High School - Annex
- Politeknik Caltex Riau
- Yokohama City University
- SGT University
- University of Al-Qadisiyah
- Divine Word College of Vigan
- Techniek College Rotterdam
- Universidade de Santiago
- Universiti Teknologi MARA Cawangan Johor Kampus Pasir Gudang
- Poltekkes Kemenkes Yogyakarta
- Baguio City National High School
- Colegio san marcos
- preparatoria uno
- Centro de Bachillerato Tecnológico Industrial y de Servicios No. 107
- Dalian Maritime University
- Quang Trung Secondary School
- Colegio Tecnológico en Informática
- Corporación Regional de Educación Superior
- Grupo CEDVA
- Dar Al Uloom University
- Centro de Estudios Preuniversitarios de la Universidad Nacional de Ingeniería
- 上智大学
- Aakash International School, Nuna Majara
- San Felipe Neri Catholic School
- Kang Chiao International School - New Taipei City
- Misamis Occidental National High School
- Institución Educativa Escuela Normal Juan Ladrilleros
- Kolehiyo ng Pantukan
- Batanes State College
- Instituto Continental
- Sekolah Menengah Kejuruan Kesehatan Kaltara (Tarakan)
- Colegio de La Inmaculada Concepcion - Cebu


