Assess the extent to which the Park Model of human responses applies to TWO or more recent hazard events you have studied PDF

| Title | Assess the extent to which the Park Model of human responses applies to TWO or more recent hazard events you have studied |
|---|---|
| Author | bansi mehta |
| Course | Physical Geography |
| Institution | Sixth Form (UK) |
| Pages | 2 |
| File Size | 53.5 KB |
| File Type | |
| Total Downloads | 8 |
| Total Views | 126 |
Summary
essay...
Description
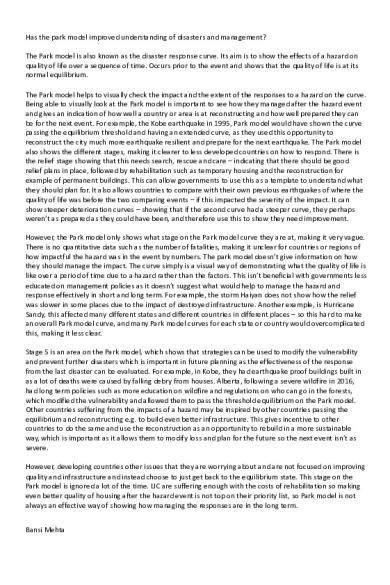
Has the park model improved understanding of disasters and management? The Park model is also known as the disaster response curve. Its aim is to show the effects of a hazard on quality of life over a sequence of time. Occurs prior to the event and shows that the quality of life is at its normal equilibrium. The Park model helps to visually check the impact and the extent of the responses to a hazard on the curve. Being able to visually look at the Park model is important to see how they managed after the hazard event and gives an indication of how well a country or area is at reconstructing and how well prepared they can be for the next event. For example, the Kobe earthquake in 1995, Park model would have shown the curve passing the equilibrium threshold and having an extended curve, as they used this opportunity to reconstruct the city much more earthquake resilient and prepare for the next earthquake. The Park model also shows the different stages, making it clearer to less developed countries on how to respond. There is the relief stage showing that this needs search, rescue and care – indicating that there should be good relief plans in place, followed by rehabilitation such as temporary housing and the reconstruction for example of permanent buildings. This can allow governments to use this as a template to understand what they should plan for. It also allows countries to compare with their own previous earthquakes of where the quality of life was before the two comparing events – if this impacted the severity of the impact. It can show steeper deterioration curves – showing that if the second curve had a steeper curve, they perhaps weren’t as prepared as they could have been, and therefore use this to show they need improvement. However, the Park model only shows what stage on the Park model curve they are at, making it very vague. There is no quantitative data such as the number of fatalities, making it unclear for countries or regions of how impactful the hazard was in the event by numbers. The park model doesn’t give information on how they should manage the impact. The curve simply is a visual way of demonstrating what the quality of life is like over a period of time due to a hazard rather than the factors. This isn’t beneficial with governments less educated on management policies as it doesn’t suggest what would help to manage the hazard and response effectively in short and long term. For example, the storm Haiyan does not show how the relief was slower in some places due to the impact of destroyed infrastructure. Another example, is Hurricane Sandy, this affected many different states and different countries in different places – so this hard to make an overall Park model curve, and many Park model curves for each state or country would overcomplicated this, making it less clear. Stage 5 is an area on the Park model, which shows that strategies can be used to modify the vulnerability and prevent further disasters which is important in future planning as the effectiveness of the response from the last disaster can be evaluated. For example, in Kobe, they had earthquake proof buildings built in as a lot of deaths were caused by falling debry from houses. Alberta, following a severe wildfire in 2016, had long term policies such as more education on wildfire and regulations on who can go in the forests, which modified the vulnerability and allowed them to pass the threshold equilibrium on the Park model. Other countries suffering from the impacts of a hazard may be inspired by other countries passing the equilibrium and reconstructing e.g. to build even better infrastructure. This gives incentive to other countries to do the same and use the reconstruction as an opportunity to rebuild in a more sustainable way, which is important as it allows them to modify loss and plan for the future so the next event isn’t as severe. However, developing countries other issues that they are worrying about and are not focused on improving quality and infrastructure and instead choose to just get back to the equilibrium state. This stage on the Park model is ignored a lot of the time. LIC are suffering enough with the costs of rehabilitation so making even better quality of housing after the hazard event is not top on their priority list, so Park model is not always an effective way of showing how managing the responses are in the long term. Bansi Mehta
Lastly the Park model is useful to compare and contrast hazard events between countries. Clear curves help’s to compare one area to another area with their Park model curve, to see for example if their wealth is important in the management of impacts of the certain hazard. It also can compare how well countries are in preparing its people for the storms or how ineffective countries are, and how this influences impacts and responses. For example, Tacloban in the Philippines had the most economic damage and fatalities in the Philippines because of their lack of warnings and preparation. This can be used for future planning such as how this can be overcome with more effective warning signals. The Park model helps to visualize and compare and contrast events to analyse what worsens the impacts and limits responses, to help for future planning and management. However, the park model does not show exactly what was done before the event to mitigate, or what was planned after the event before the next event – to show if any improvements have been made in responding and if past management plans has led to reduced severity of the impacts. This is important as all that is clear is just a curve but does not take into consideration of other factors such as if there was an event directly before the event. For example, Haiti suffered from Storm Irene before Hurricane Sandy and was still recovering from the Haiti earthquake, devastating the country, which would therefore show a much steeper curve than a country which had not suffered so many events before. It is also a weakness as sometimes these considerations such as having previous events, is not looked at as something that should be supported in managing, for example Haiti could receive more aid than they would have received in the past – to allow for effective reconstruction that is sustainable and prevent as many losses and damage from being an area constantly hit by hazards. The reasons for impacts are ignored as they are ignored on the Park model as it only shows the severity of the impacts – limiting what they visualize to improve their management. Overall, I believe that the park model is effective in being able to visualize the extent of the impacts however it does not show the reasons for the impact and how management can be improved specifically as the Park model is vague. Some areas of the Park model is ignored such as stage 5, and there is also not enough information, especially quantitative data – limiting what can be used to judge the effects and management.
Bansi Mehta...
Similar Free PDFs

TO-HAVE - Appunti TO HAVE
- 5 Pages

Intro to the Human Body
- 5 Pages

Introduction to the Human Body
- 9 Pages
Popular Institutions
- Tinajero National High School - Annex
- Politeknik Caltex Riau
- Yokohama City University
- SGT University
- University of Al-Qadisiyah
- Divine Word College of Vigan
- Techniek College Rotterdam
- Universidade de Santiago
- Universiti Teknologi MARA Cawangan Johor Kampus Pasir Gudang
- Poltekkes Kemenkes Yogyakarta
- Baguio City National High School
- Colegio san marcos
- preparatoria uno
- Centro de Bachillerato Tecnológico Industrial y de Servicios No. 107
- Dalian Maritime University
- Quang Trung Secondary School
- Colegio Tecnológico en Informática
- Corporación Regional de Educación Superior
- Grupo CEDVA
- Dar Al Uloom University
- Centro de Estudios Preuniversitarios de la Universidad Nacional de Ingeniería
- 上智大学
- Aakash International School, Nuna Majara
- San Felipe Neri Catholic School
- Kang Chiao International School - New Taipei City
- Misamis Occidental National High School
- Institución Educativa Escuela Normal Juan Ladrilleros
- Kolehiyo ng Pantukan
- Batanes State College
- Instituto Continental
- Sekolah Menengah Kejuruan Kesehatan Kaltara (Tarakan)
- Colegio de La Inmaculada Concepcion - Cebu


