Cost-Volume-Profit Relationship - Google Docs PDF

| Title | Cost-Volume-Profit Relationship - Google Docs |
|---|---|
| Course | Intro Managerial Accounting |
| Institution | George Washington University |
| Pages | 3 |
| File Size | 111.1 KB |
| File Type | |
| Total Downloads | 6 |
| Total Views | 143 |
Summary
professor sul...
Description
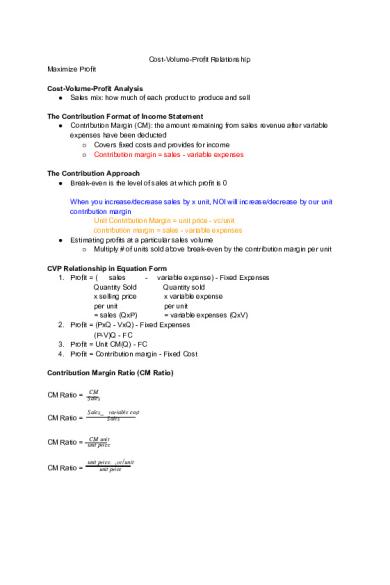
Cost-Volume-Profit Relationship Maximize Profit Cost-Volume-Profit Analysis ● Sales mix: how much of each product to produce and sell The Contribution Format of Income Statement ● Contribution Margin (CM): the amount remaining from sales revenue after variable expenses have been deducted ○ Covers fixed costs and provides for income ○ Contribution margin = sales - variable expenses The Contribution Approach ● Break-even is the level of sales at which profit is 0
●
When you increase/decrease sales by x unit, NOI will increase/decrease by our unit contribution margin Unit Contribution Margin = unit price - vc/unit contribution margin = sales - variable expenses Estimating profits at a particular sales volume ○ Multiply # of units sold above break-even by the contribution margin per unit
CVP Relationship in Equation Form 1. Profit = ( sales - variable expense) - Fixed Expenses Quantity Sold Quantity sold x selling price x variable expense per unit per unit = sales (QxP) = variable expenses (QxV) 2. Profit = (PxQ - VxQ) - Fixed Expenses (P-V)Q - FC 3. Profit = Unit CM(Q) - FC 4. Profit = Contribution margin - Fixed Cost Contribution Margin Ratio (CM Ratio) CM
CM Ratio = Sales CM Ratio =
Sales variablecost Sales
CM unit CM Ratio = unitprice
CM Ratio =
unitprice vc /unit unitprice
5. Profit = CM ratio x Sales - Fixed Costs Target Profit in Units Profit = unit CM x Q - Fixed Expenses P rof it+F ixedExpenses unitCM
Q=
Unit Sales =
how many units you need to sell to reach target profit
P rof it+F ixedExpenses unitCM
Dollar Sales =
P rof it+F ixedExpenses CM Ratio
Break-Even Analysis in Units ● To determine unit sales and dollar sales needed to achieve a target profit of 0 ○
Break Even (Unit Sales) =
○ Break Even ($ Sales) =
F ixedExpenses unitCM
F ixedExpenses CM Ratio
Margin of Safety ($, units, %) Margin of safety ($) = Total Budgeted (actual) sales - break-even sales Margin of safety (units) = Total # of units - break even units Marginof saf etyin$
Margin of safety (%) = Actual budgetedsales / Ex: if margin of safety was 20%, it means you can have a 20% decrease in sales and still be able to break-even Operating Leverage ● Measure of how sensitive net operating income is to percentage changes in sales ● Measure at any given level of sales of how a percentage change in sales volume will affect profits
●
ContributionMargin
Degree of Operating Leverage = NetOperatingIncome So if D.O.L is 2, if sales increase by 10%, NOI will increase by 20%
Sales Mix ● Relative percentage in which company sell its products ● Sales mix is important because different products often have very different contribution margins ○ Sell more of the more profitable product
●
Sales mix is a calculation that determines the proportion of each product a business sells relative to total sales ○ Significant because some products or services may be more profitable than others, and if a company’s sales mix changes, its profit also changes ○ Look at contribution ratio of each individual product
Company CM Ratio =
CompanyCM (CompanyT otalSales T otalV ariableExpenses) CompanyT otalSales
...
Similar Free PDFs

Untitled document - Google Docs
- 3 Pages

Shame Final - Google Docs
- 3 Pages

History Notes - Google Docs
- 22 Pages

Philosophy Lecture - Google Docs
- 39 Pages

HDFS Notes - Google Docs
- 8 Pages

Screenplay - Google Docs
- 3 Pages

Spatial Histories - Google Docs
- 6 Pages

Socialism - Google Docs
- 1 Pages

Maslow Activity - Google Docs
- 1 Pages

Pregrancy bp - Google Docs
- 5 Pages

Aristocracy - Google Docs
- 1 Pages

CM6.odt - Google Docs
- 4 Pages

Draft poem - Google Docs
- 2 Pages

Lab #5 - Google Docs
- 3 Pages

Building DNA - Google Docs
- 3 Pages
Popular Institutions
- Tinajero National High School - Annex
- Politeknik Caltex Riau
- Yokohama City University
- SGT University
- University of Al-Qadisiyah
- Divine Word College of Vigan
- Techniek College Rotterdam
- Universidade de Santiago
- Universiti Teknologi MARA Cawangan Johor Kampus Pasir Gudang
- Poltekkes Kemenkes Yogyakarta
- Baguio City National High School
- Colegio san marcos
- preparatoria uno
- Centro de Bachillerato Tecnológico Industrial y de Servicios No. 107
- Dalian Maritime University
- Quang Trung Secondary School
- Colegio Tecnológico en Informática
- Corporación Regional de Educación Superior
- Grupo CEDVA
- Dar Al Uloom University
- Centro de Estudios Preuniversitarios de la Universidad Nacional de Ingeniería
- 上智大学
- Aakash International School, Nuna Majara
- San Felipe Neri Catholic School
- Kang Chiao International School - New Taipei City
- Misamis Occidental National High School
- Institución Educativa Escuela Normal Juan Ladrilleros
- Kolehiyo ng Pantukan
- Batanes State College
- Instituto Continental
- Sekolah Menengah Kejuruan Kesehatan Kaltara (Tarakan)
- Colegio de La Inmaculada Concepcion - Cebu
